Will biofuels, electric vehicles, plug-in hybrids, hydrogen fuel cell vehicles, or something else transform the US vehicle fleet? How will this affect costs, emissions, and energy imports?
Find out with Lumina’s Analytica Transportation Energy Assessment Model (ATEAM).
The challenge
How can the US reduce greenhouse gas emissions from its automobile fleet without increasing costs? How vulnerable is the US to a disruption in oil supply and a spike in oil prices?
How near are we to a tipping point in adoption of electric vehicles? What policies can best accelerate — or slow down — the transition to a cleaner and more efficient fleet?
Lumina’s Analytica Transportation Energy Assessment Model (ATEAM) offers a way to explore possible futures and identify the key assumptions and drivers. The US Department of Energy, Vehicle Technology Office, supported Lumina to build ATEAM.
ATEAM covers a full range of fuel types, including gasoline, diesel, ethanol and advanced biofuels, electric vehicles, plug-in hybrids, hydrogen fuel cell vehicles, and concentrated or liquefied natural gas (CNG or LNG).
The range of options and pathways from well to wheel – or field to wheel – make it ever more challenging to select an ideal portfolio of automotive technologies. There remain large uncertainties about the technical and commercial viability of many options, and the time it will take for them to scale up.
Understanding possible futures and clarifying the interactions between the technologies and policies is important for lots of us — ranging from government to car makers, oil and gas companies, battery manufacturers, environmental groups, and, in fact, all of us.
Why Analytica?
Analytica’s influence diagrams make models easier to create, communicate, and maintain. It’s easy to develop a graphical user interface that permits clients to do scenario analysis with little effort.
Analytica offers an efficient and effective framework, which stems from its intelligent array algorithm. It offers users the flexibility to start simple, and extend to multi-dimensional models. It also allows for greater responsiveness to stakeholder’s requests for new scenarios or technologies with minimal effort.
Our goal is to design an agile model to support rapid interactive exploration of scenarios analysis, sensitivity analysis and uncertainty analysis for energy pathways for transportation.
The solution
Lumina has developed ATEAM (the Analytica Transportation Energy Assessment Model) to allow flexible exploration of these challenging issues. It represents a wide range of technologies, and projects how a reduction in costs and increase in availability of new fuels and technologies can lead to increasing market penetration.
It models cars, light trucks, SUVs, and heavy-duty vehicles. It is designed for rapid exploration of alternative scenarios, to understand key sensitivities and points of leverage. ATEAM is being used to investigate the capacity to reduce GHG emissions and oil imports and save costs of transportation.
We explore various alternative fuel vehicle technologies including flexible fuel vehicles, electric vehicles, hydrogen fuel cell vehicles, CNG/LNG, or simple improvements to ICE efficiency.
The model simulates the interaction between the policy decisions such as the renewable fuel standard (RFS), low-carbon fuel standard, CAFÉ (fleet efficiency), tax credits and incentives by technology, biofuel credits and tariffs, or a carbon tax.
ATEAM offers a highly interactive, transparent and intuitive user-interface which allows users to extend the set of vehicle-level variables (propulsion engine, fuel type, weight, size), adjust key assumptions, and conduct rapid scenario analysis, sensitivity analysis and uncertainty analysis.
It displays visual influence diagrams that allow users to explore the details of the model, as shown below.
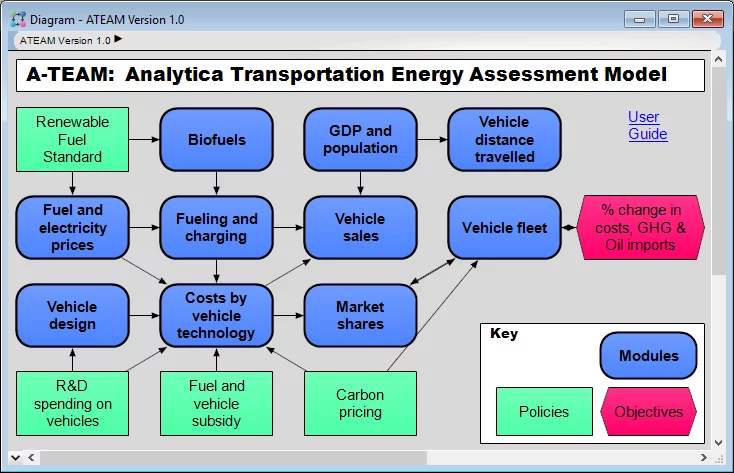
This influence diagram shows the top level of ATEAM. The green rectangle are selected policy decisions.
The blue nodes are modules that can be opened up to modify assumptions and explore their implications.
Sensitivity analysis, uncertainty analysis and scenario analysis
ATEAM requires many assumptions that are unavoidably uncertain, including the future price of oil, cost of biofuels and batteries, improvements in efficiency of combustion engines, light weighting efficacy, GDP growth, and consumer preferences.
It offers rapid sensitivity analysis, uncertainty analysis and scenario analysis to identify which inputs are the key drivers, and how changes in assumptions can affect the results.
By setting up the input variables and outputs, you can conduct such analysis in a minute. The tornado graph below shows an example of the sensitivity of the effects of a range of key input assumptions on the reduction of GHG emissions over the next 20 years.

This tornado chart shows that EV adoption rates is quite sensitive to a variety of assumptions. This makes it hard to predict the time of the tipping point at which new buyers will purchase more EVs than liquid fuel vehicles.
The reason is that adoption of EVs, like many new technologies, is a process with several positive feedback cycles. Increasing sales of EVs leads to a wider variety of EV models, more widespread charging stations, and cheaper batteries.
This Analytica influence diagrams shows this last feedback cycle, where increased EV sales, leads to increased battery production, and hence reduced battery costs, and increased choice of EVs.
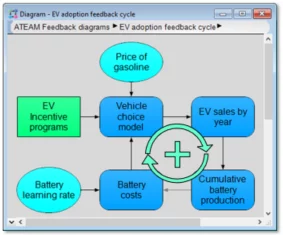
ATEAM models these positive feedback explicitly as part of its dynamic systems model — unlike most other vehicle adoption models that treat either EV sales or battery costs as exogenous inputs.
For this reason ATEAM shows the high sensitivity to initial conditions that is a feature of the real world systems, which is absent from these other models.
Results
ATEAM allows users to extend the set of vehicle definitions, interactively explore the effect of changing input assumptions on the outputs.
The following figures are sample results:
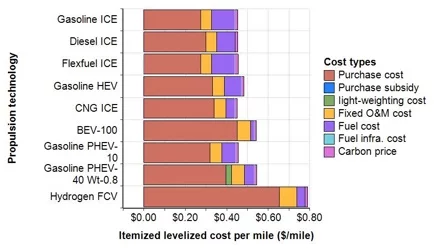
The levelized life cycle cost per mile in 2020 by propulsion technology, broken down by purchase cost and subsidy, light weighting, operating and maintenance (O & M), fuel cost, fuel infrastructure, and a possible carbon price.
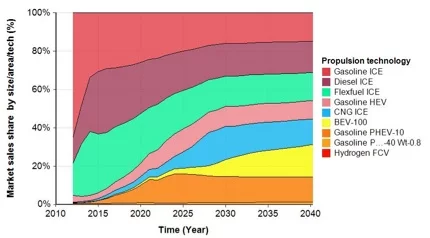
Market share of new sales by propulsion technology estimated using a logit choice model based on consumer perceptions of value and costs.
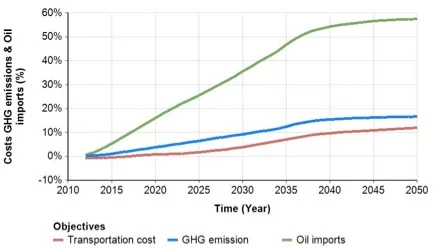
Reduction in transportation cost, GHG emissions and oil imports from the light-duty vehicle fleet in the scenario computed using the sales share illustrated in the figure above this one compared to AEO reference scenario (AEO 2012).
The work was supported by Pacific Northwest National Laboratories and US Department of Energy, Vehicle Technology Office.