Beyond the spreadsheet
According to studies 94% of spreadsheets contain serious errors. Each year, spreadsheet errors cause businesses to lose billions of dollars. Key reasons include obscure cell addresses, inconsistent formulas, and difficulties in managing multiple dimensions. Analytica’s visual modeling environment and intelligent arrays provide a level of transparency, scalability, and reliability that spreadsheet users find a revelation. It enables users to develop, verify, communicate, and maintain models many times faster than with cumbersome spreadsheets.
“Everything that’s wrong with the common PC spreadsheet is fixed in Analytica.”

Review in
PC Week/eWeek


Transparency: influence diagrams
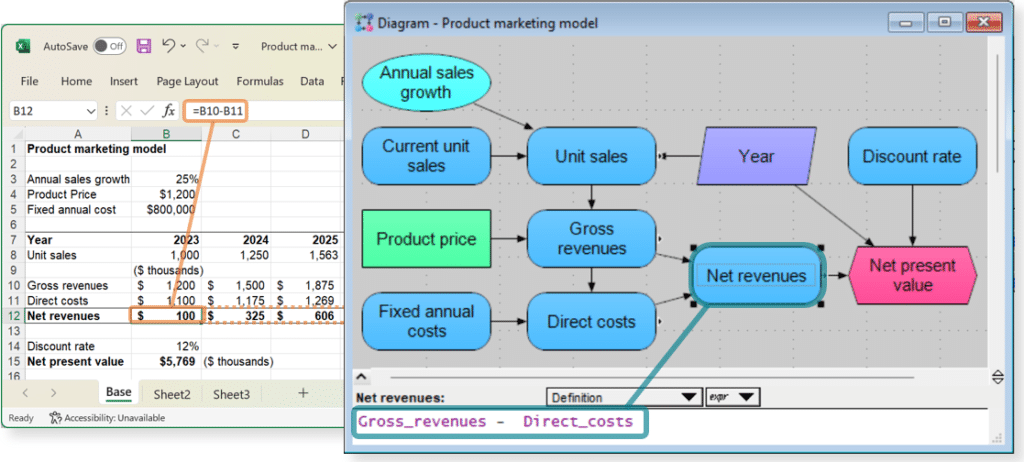
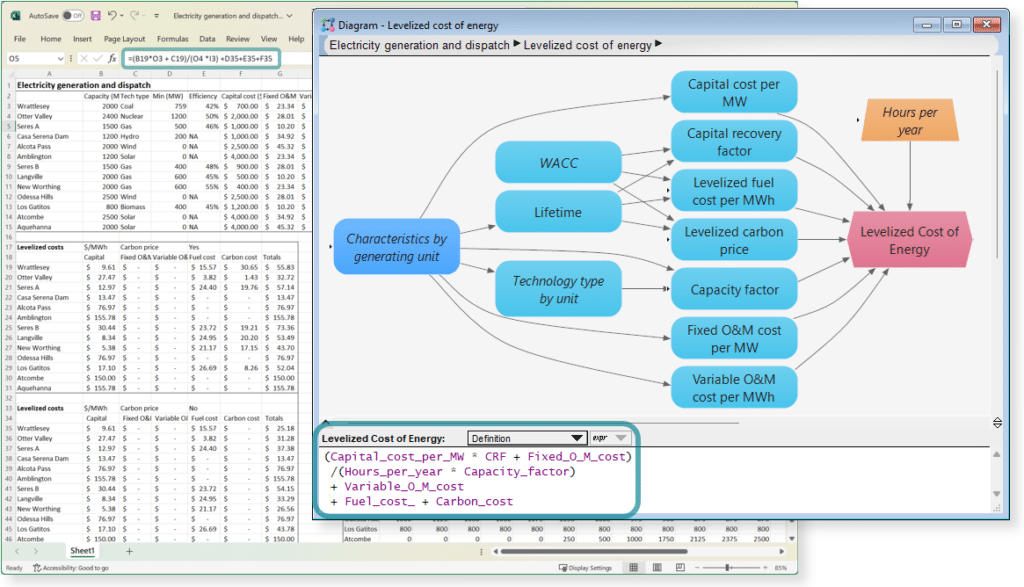
Spreadsheets force you to work at the level of cells rather than thinking at the higher conceptual level of variables, decisions, and objectives, and how they influence each other. Experienced spreadsheet modelers often start by drawing a diagram of the key elements with arrows showing relationships. But, such diagrams aren’t connected to the spreadsheet. So they become inconsistent as you develop the model.
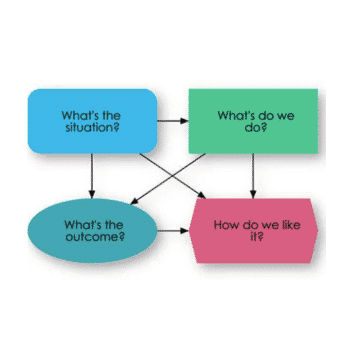
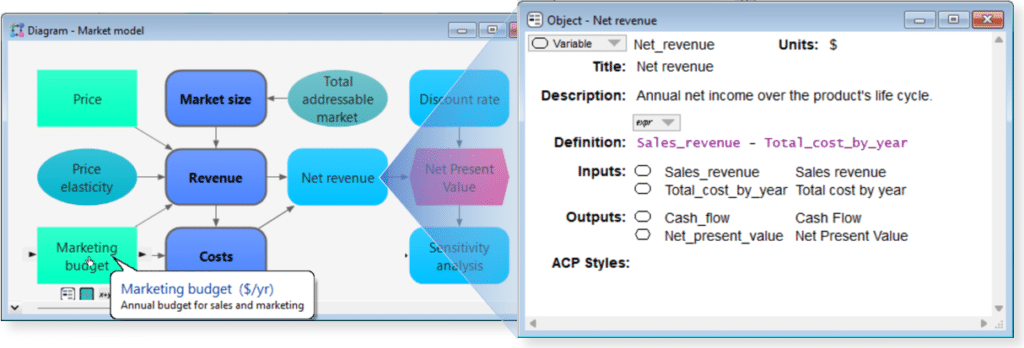
Analytica’s influence diagrams make it natural to think at the conceptual level for structuring a model. You designate each node as a decision, objective, uncertainty, and so on, depicted by its shape and color. You draw arrows to show how those variables influence each other. The arrows update automatically to reflect changes in definitions to maintain consistency. These diagrams become an intuitive visual interface to navigate, organize, and explain models. If a dependency is missing or in the wrong place—errors that often go unnoticed in spreadsheets—it becomes immediately obvious.
“Analytica is so much easier to use than spreadsheets. The brilliant thing is its influence diagrams. First you build a model graphically, and then fill in the details.”

Fisheries and Oceans Canada, Winnipeg, Canada
Flexibility: intelligent arrays
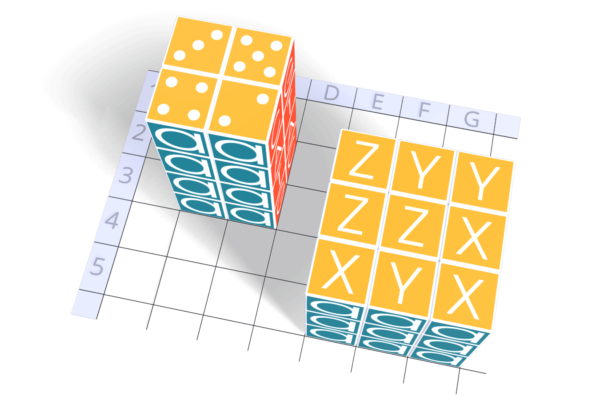
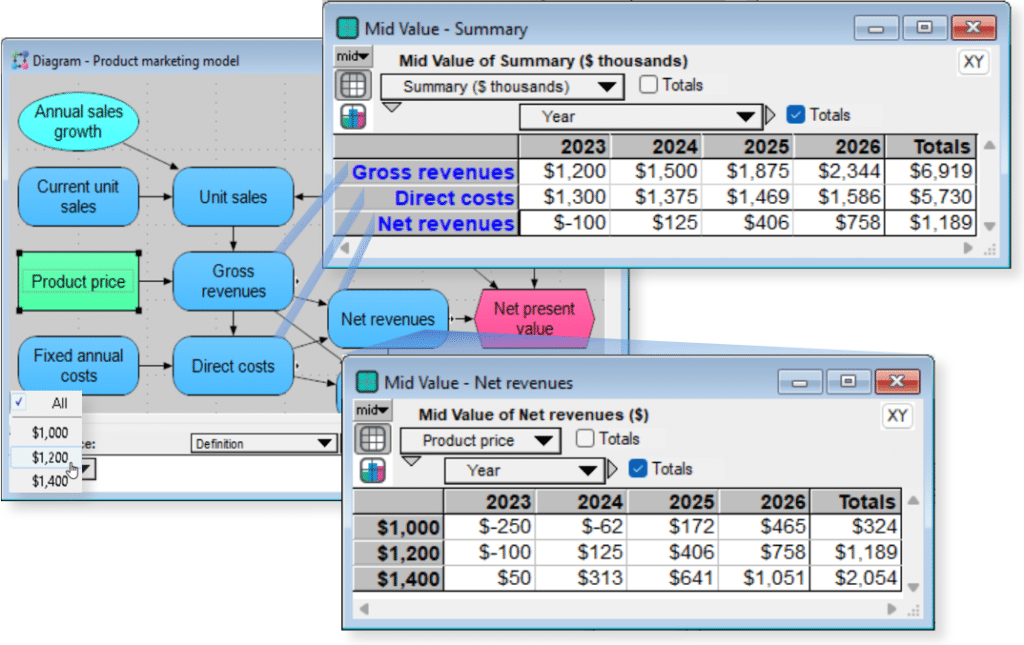
Intelligent arrays dramatically improve model agility and reduce errors. Experienced modelers know that managing dimensions is a big challenge in building a spreadsheet model. Should you represent time by years, months, or days? To what horizon? Should you separate business units, geographic regions, or products? How many scenarios do you need? It is notoriously painful and error-prone to modify or add dimensions in a spreadsheet—especially for more than two dimensions. Intelligent arrays make this easy and reliable.
Each variable may contain a single number or an array with one or many dimensions. It has a single formula (definition) expressing how it is influenced by other variables — instead of a separate formula in each cell. When you modify or add a dimension, all affected variables handle the changes automatically. This means you can start by building a simple model, and easily add detail and dimensions as you go.
“Unlike spreadsheets, the World has more than two dimensions. That’s why you need Analytica.”

Sam Savage, PhD
President of ProbabilityManagement.org and author of The Flaw of Averages.
Clarity: integrated documentation
If you’ve ever had to work on a spreadsheet built by someone else—or even one that you created yourself—you know how hard it can be to figure out what it was intended to do. Analytica’s influence diagrams provide a high-level conceptual map of the dependencies among variables. Each variable along with its formula has a field for its units, a description of what it represents, and optionally the data-source. It automatically shows its inputs and outputs. This integrated documentation makes models much easier to understand and navigate— especially with teams and over time.
“Analytica cuts through the spreadsheet obfuscation”
Review in
Intelligent Enterprise
Reliability: avoid error-prone spreadsheets
Research on critical spreadsheets used in organizations has found that the majority have significant errors. That’s because it’s easy to make errors in spreadsheets, yet hard to detect them. Most spreadsheet users already know that from bitter experience.
Analytica’s intuitive variable titles and influence diagrams showing how variables affect each other, dramatically reduce the frequency of errors. And when errors do occur, they are easier to locate. Due to the power of intelligent arrays, an Analytica model has hundreds or thousands of times fewer formulas (“definitions”) than an equivalent spreadsheet. The result is a corresponding massive reduction in the time and effort to build, debug, audit, and maintain models.
“Analytica is designed for business analysts seeking a tool that is more visual, flexible, powerful – and less error-prone – than the common spreadsheet…”
DM Review
Integration: plays nicely with spreadsheets and other data sources
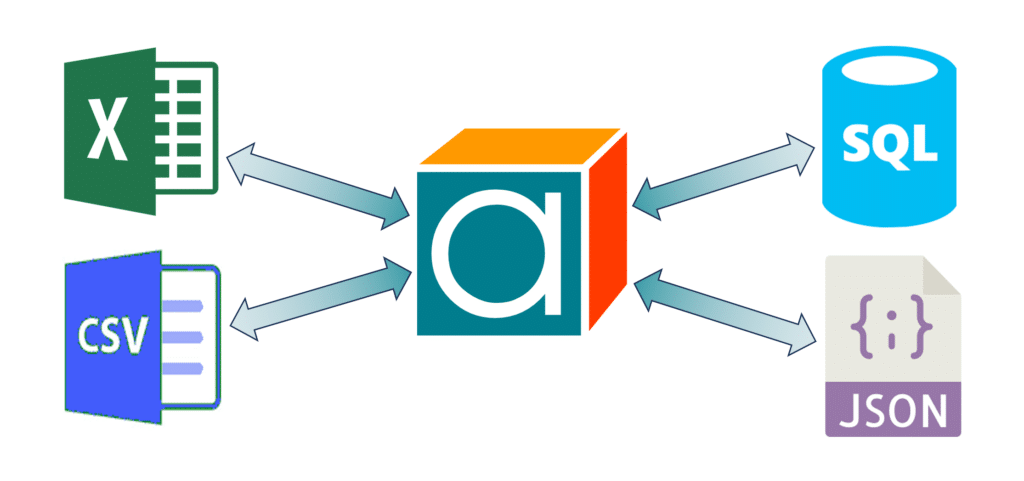
Your organization likely has many spreadsheets embedded across its business processes. Analytica models can work directly with these existing spreadsheets. It has comprehensive functions to read data (sheets, cell ranges, named ranges, and even formulas) from spreadsheets and save results back to them. It has similar functions to read and write CSV, JSON, XML, databases, and binary files. In this way, Analytica models can play nicely within your existing data ecosystem.
“Analytica makes an excellent replacement for a spreadsheet since models can be constructed directly from relationships without being constrained by the row and column paradigm of a spreadsheet.”

David Neiger
Australian Engineer Magazine


