 A new Stanford-led study on natural gas leak rates from oil and gas activity across a large fraction of the US are about 3x more than previous government estimates. The research by Evan Sherwin and 12 coauthors was published in Nature on March 14, 2024. They combined data from approximately 1 million aerial site measurements with a simulation model using ground-based measurements. The results have big implications on what it will take for the US and other countries to meet the reductions in methane emissions they committed to.
The challenge
Carbon dioxide is the most notorious culprit as a greenhouse gas. But, the Intergovernmental Panel on Climate Change (IPCC) estimates that methane, its less famous accomplice, contributes over 30% of anthropogenic global warming. That’s why, at the 2021 United Nations Climate Change Conference in Glasgow (COP26), world leaders pledged large cuts to their countries’ methane emissions.
Methane is the primary constituent of the natural gas we use to cook with, heat our homes, and currently generates about 40% of the electricity in the US. Gas is advertised as “clean”, because its combustion produces only half as much CO2 as coal, per unit of energy. Unfortunately, methane causes over 20 times more global warming than carbon dioxide per unit volume. So even a small percentage of gas leaking unburnt into the atmosphere is a big problem.
So, how much natural gas does leak? Gas is invisible, so you need special sensors to detect it. Recent advancements in remote sensing technology from aerial surveys, and now satellites, have revealed large point-source methane emissions, usually from oil and gas wells, that were overlooked previously by ground-based surveys. Large leaks are often quite brief, so you need to be looking at the right time. The challenge for this project was to transform a relatively small number of detected emissions from aerial surveys covering a large fraction of assets in a region into reliable estimates of leakage rates.
Why Analytica?
According to the lead author of this article, Dr Evan Sherwin, formerly at Stanford, now at Lawrence Berkeley National Lab:
"Without Analytica, it could easily have taken me another year to finish this analysis. To convert data from huge aerial methane surveys into decision-relevant insights, I needed to write code manipulating large multidimensional arrays and incorporate numerous uncertainties through Monte Carlo analysis. Analytica is rightly a leading software platform for precisely this sort of work.
Most importantly, as is usually the case in science, I was constantly designing and redesigning my model as I developed it. Analytica’s modular influence diagram-based coding platform made it possible for me to rapidly make large changes to the underlying structure of my model in a way that would have been very time-consuming in a conventional scripting language. It is also hard to overstate how valuable it is to visually see how different variables in a model relate to each other."
The solution
The approach was to estimate a complete distribution of methane emissions, combining data from comprehensive aerial surveys and state-of-the-art component-level emission simulation tools. By combining results from large-scale aerial surveys with Monte Carlo simulations based on ground-based measurements they generated region-specific emissions distributions to capture the full range of methane emission rates, from the smallest to the largest sources. Using the ground-based model, they estimated the probability that emissions of each size would be missed by aerial survey, and used this to adjust the overall estimates. This comprehensive approach produced more accurate estimates of total methane emissions.
Results
The combined emissions distribution generated using Analytica was consistent with major ground-based and aerial methane measurement studies, validating the effectiveness of the approach. By incorporating data from approximately 1 million site visits and refining the emissions simulation model with regional characteristics, the authors were able to overcome the limitations of traditional estimation methods and provide a more accurate representation of methane emissions across six US oil and gas-producing regions. This improved understanding of methane emissions distribution is critical for informing methane emissions inventory development and guiding mitigation efforts in the oil and gas sector.
The findings underscore the inadequacy of current monitoring methods and regulatory frameworks in accurately assessing and mitigating methane leakage. Addressing these emissions could yield substantial economic and environmental benefits.
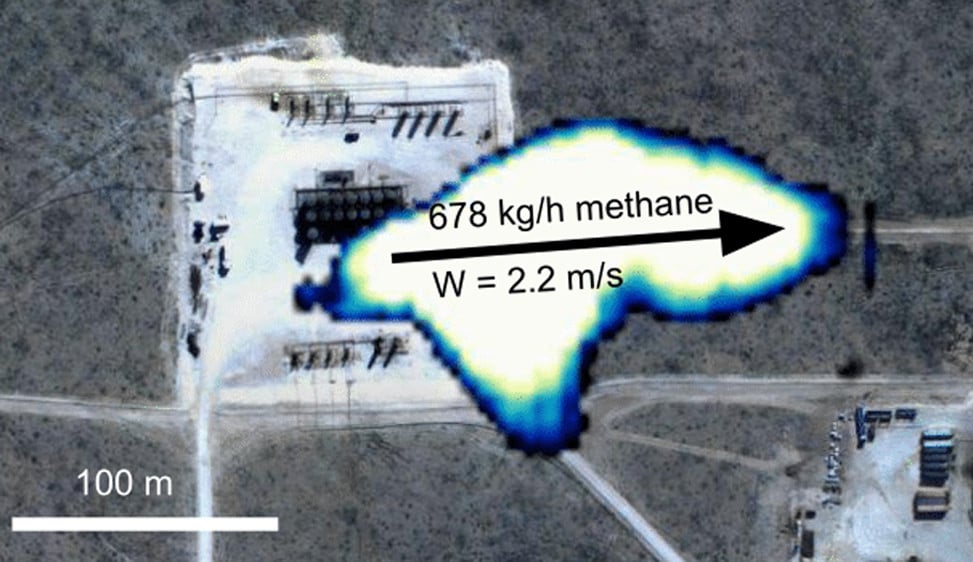
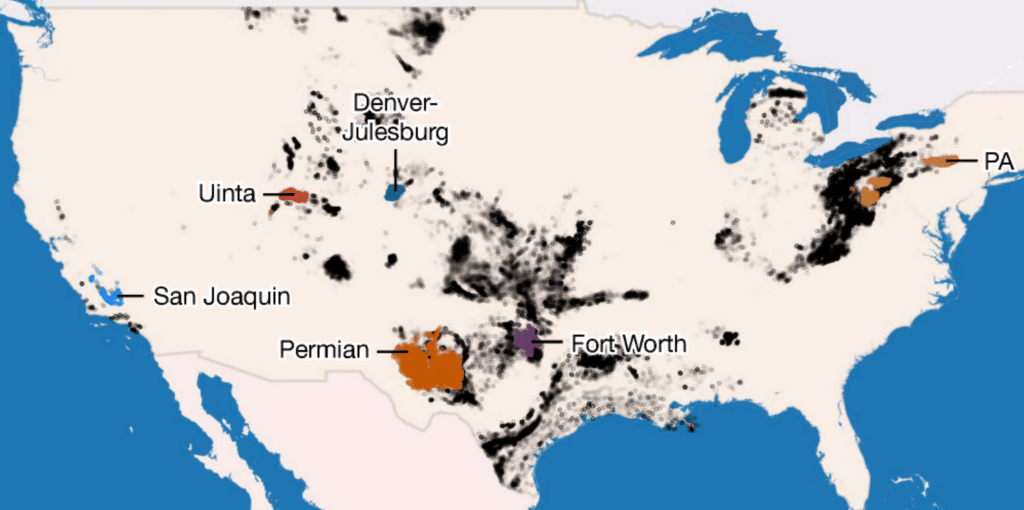
The aerial surveys from 15 flight campaigns across all six regions, produced over a thousand hours of aerial data with almost a million well site measurements. The surveyed areas within these regions comprise 29% of onshore US gas production and 52% of oil production.
Key insights
- The production-weighted loss rates over the six regions was 2.95% (95% CI 2.79%, 3.14%). (The confidence intervals (CI) arise from the uncertainties modeled by the Monte Carlo simulation.)
- The estimated methane loss rates varied by region, over an order of magnitude—from 0.75% (95% CI 0.65%, 0.84%) in the Appalachian basin in Pennsylvania, up to 9.63% (95% CI 9.04%, 10.39%) the Permian basin in New Mexico.
- Most emissions could be detected aerially, contributing 50–79% of the total emissions at well sites in 11 flight campaigns.
- The main reason this study estimated higher emissions than previous studies was the vast spatial extent of the campaigns that included emissions from the small fraction of sites (1.66% or less) responsible for the majority of emissions, which were underestimated by previous onsite measurements.
- Regional estimates align closely with recent aerial mass balance flights and measurements from onsite towers. They suggest that estimates based on TROPOMI satellite measurements are conservative.
- National methane emissions reports to the UN are probably conservative because they rely on out-of-date emissions factors from the US Greenhouse Gas Inventory (GHGI).
- Aerial measurements can help validate and calibrate estimates from new satellite sensors, currently being deployed.
- The quantified methane emissions represent a loss of roughly $1 billion in gas sales and $9.3 billion in social cost, annually.
- Substantial methane emission reductions could be achieved by highly targeted interventions on the small fraction of sites that contribute the large majority of emissions.
The methods introduced in this study that combine measurements at multiple scales will enable more reliable and timely tracking of the reductions in methane emissions to which many countries have committed.
Authors


Evan D. Sherwin, Jeffrey S. Rutherford, Zhan Zhang, Yuanlei Chen, Erin B. Wetherley, Petr V. Yakovlev, Elena S. F. Berman, Brian B. Jones, Daniel H. Cusworth, Andrew K. Thorpe, Alana K. Ayasse, Riley M. Duren & Adam R. Brandt, US oil and gas system emissions from nearly one million aerial site measurements. Nature 627, 328–334 (March 14, 2024). https://doi.org/10.1038/s41586-024-07117-5
For more
- The Guardian: US energy industry gas leaks are triple the official figures, study finds
- New York Times: Oil Fields Release Far More Methane Than Thought, Study Finds
- Webinar: Quantifying regional methane emissions in the New Mexico Permian Basin through a comprehensive aerial survey with Yulia Chen & Evan Sherwin


