Analytics without coding: beyond R & Python
Increasingly analysts build quantitative models using scripting languages like Python, R, or Matlab. It’s easy to see why they find spreadsheets too limiting. But, using these languages means you have to become a programmer — or hire one. Either way, writing code is time-consuming, error-prone, and expensive. Yes, Python and R are “free”. But consider the cost of the time spent configuring libraries, writing, testing, debugging, and maintaining the code.
Analytica combines the power and generality of R or Python with the ease of spreadsheets—actually, it’s many times easier and faster to build substantial models than spreadsheets. How is that possible? In short: Its influence diagrams and flow architecture.
“I’m using the visual programming language Analytica. The same analysis could be completed in R, Python with NumPy, Matlab, or the language of your choice. I prefer Analytica because of its visual structure, straightforward syntax.“

Dan Zoppo,
SSZ Company
Influence diagrams
You start building a model by drawing an influence diagram. You define variables by creating nodes each with a shape and color denoting its role as a decision, objective, uncertainty, index, constraint, and so on. You show their dependencies by drawing influence arrows between them. You then specify a definition for each variable as a number, array, probability distribution, or expression (formula) in terms of other variables. These diagrams are a convenient way to structure a model and communicate with your colleagues and clients. You can organize a complex model as a hierarchy of modules, each with its own influence diagram.
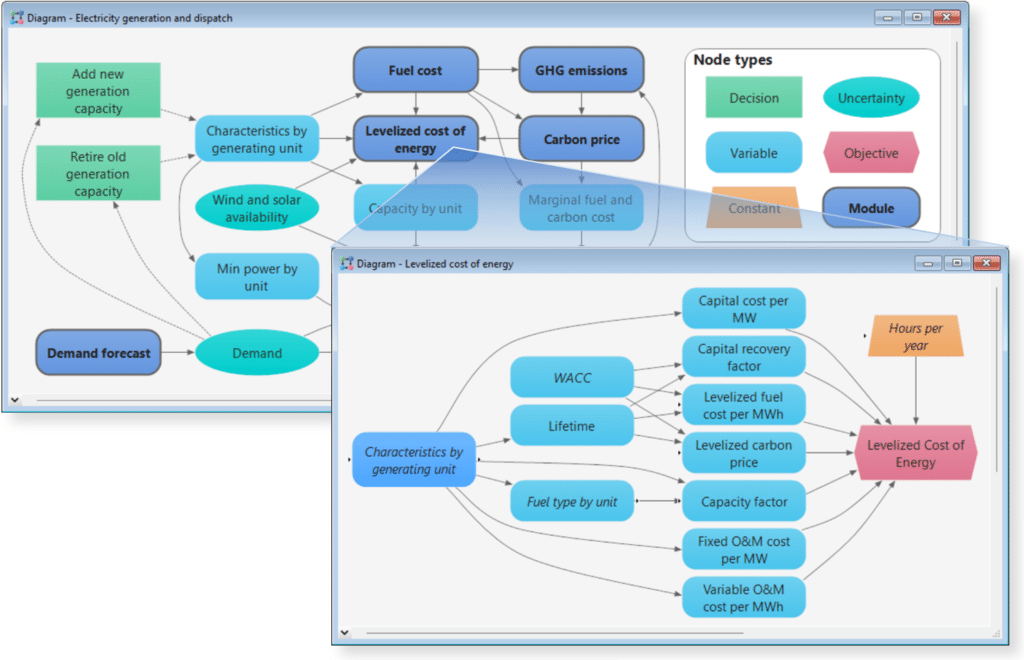
“The graphical user interface lets non-programmers, like us, build a model with minimal programming knowledge.”

James Woodcock,
University of Cambridge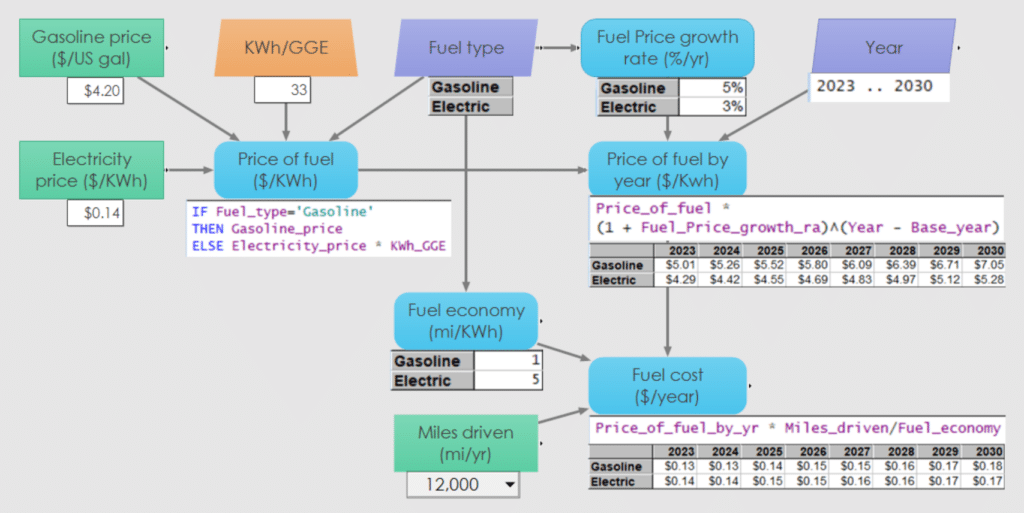
Flow architecture
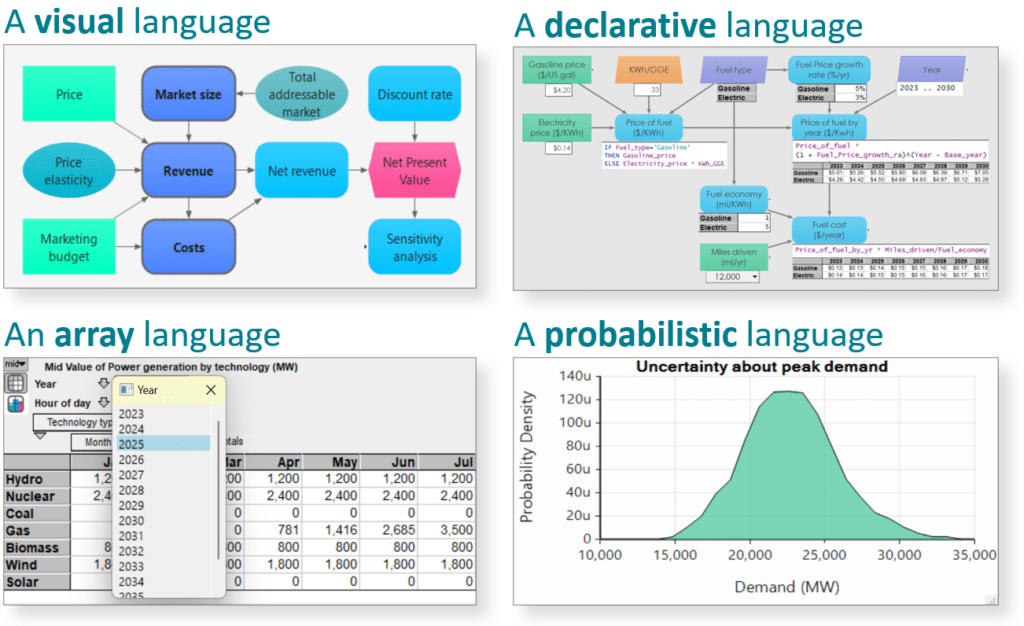
Conventional computer languages are procedural (or imperative)—with statement sequences, loops, and other control structures that determine the order of computation. With Analytica you define variables in influence diagrams in whatever order you find convenient. You can write and understand each variable’s definition by itself without having to worry about remote side-effects. Analytica manages the order of computations automatically for efficiency based on the dependency structure in the influence diagrams—without you having to think about it. A computer scientist would call Analytica a declarative language along with a flow architecture (also known as a reactive framework). This scheme makes development much easier and less bug-prone than procedural languages.
“The amount of time, headaches saved in spreadsheets and Python scripts is worth the learning curve.”

Ali Tarraf,
Mindsets, Inc. Technology Lead at Mindsets & Maker.
Intelligent arrays
Any value can be a single number or an array with one or more dimensions. Each dimension is identified by an Index variable, like Time, Products, Decision options, or Scenarios. The definition: Profit = Revenue − Expenses, works just the same if Revenue and Expenses are scalars or arrays with the different or common indexes, e.g. if are both indexed by Time. There is no need to remember the order of indexes, use FOR loops, or transpose dimensions. If you modify an index—say by adding time steps, decision options, or add a dimension—the expressions generalize automatically without needing any changes. Intelligent arrays make models much more compact, easier to read, and more reliable than conventional languages or spreadsheets. They encourage agile modeling by making it easy to change levels of detail and add dimensions as you refine and expand a model.
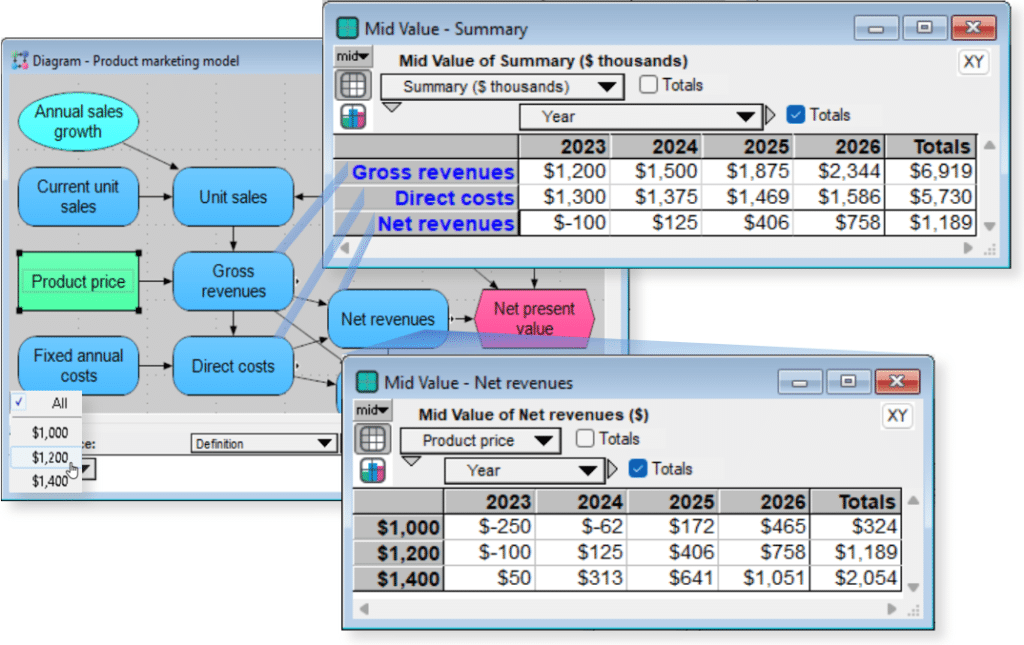
“It is by far the best language that I know for handling large dimensional arrays”

Dan Zoppo,
SSZ Company
Analytica as a computer language
A computer scientist would call Analytica a declarative language (a model consists of an unordered set of variable definitions, as we described under Flow architecture). They would also term it a visual language (based on influence diagrams), a functional language (with no side-effects), an array language (with its Intelligent Arrays), and a probabilistic language (values can be probability distributions). But, if you aren’t a computer scientist or even a programmer, you still benefit from all these features without even needing to know or care what these labels mean.
Analytica as an Integrated Development Environment (IDE)
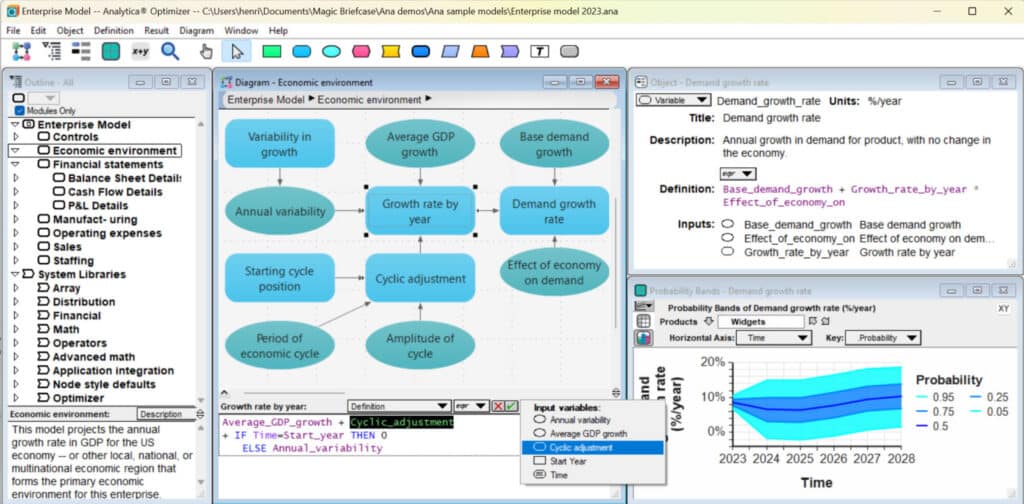
Analytica includes a fully integrated development environment (IDE) for writing, editing with syntax coloring, expression assist, executing, debugging, and deploying models organized around its visual influence diagrams. Programmers familiar with IDEs for R, Python, and other procedural languages will find this seamless integration along with its flow architecture makes model development much easier than what they are used to. When working on large models with multiple developers it is convenient to use Analytica with Github for version management.
“Analytica is not just the most powerful modeling environment, but also the best programming environment that I have ever used, and I’ve used quite a few.”

Jim Lipkis,
Monaco Risk Analytics, Inc, Los Altos, California


