
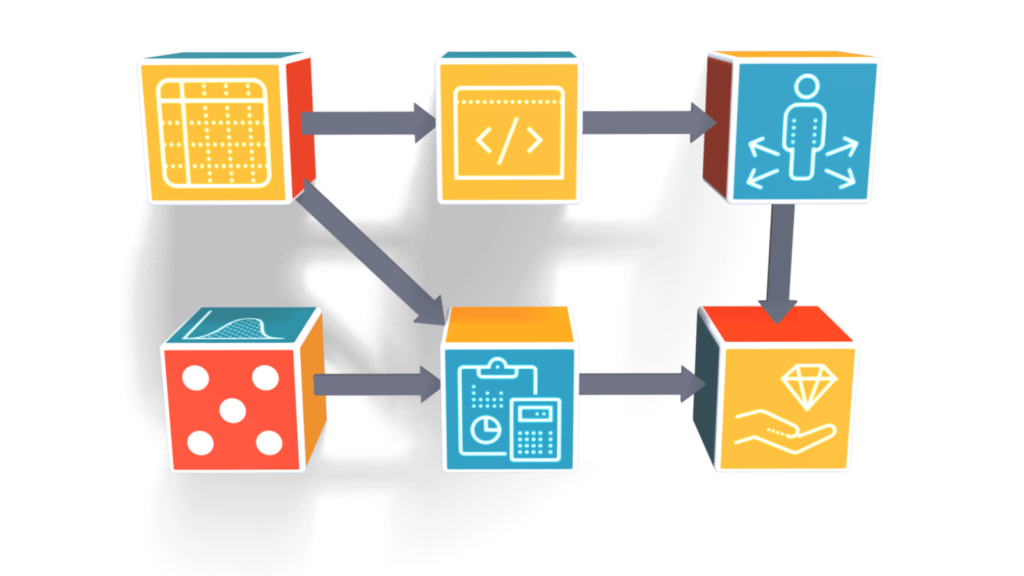
What is decision analysis?

Decision analysis is a prescriptive discipline for decision-making under uncertainty: it tells you which option to choose, not only what has happened or what people tend to do. It rests on probability, which expresses what you do not know, and utility, which expresses what you want. A coin toss settles a decision quickly, but it ignores everything you know.
Organizations often analyze data at length and rarely analyze the decision itself, meaning the alternatives, the uncertainties, and the trade-offs between objectives. In a 1982 overview, Ralph Keeney described the field as a formal version of common sense for problems too complex for the informal kind. The sections below explain when a choice needs it, how the process works, and which tools it uses.
When does a choice call for formal analysis?
A choice deserves decision analysis when five conditions hold together: you have objectives to achieve, several alternatives to choose among, consequences that differ across those alternatives, uncertainty about those consequences, and outcomes that you value differently. When only one or two of these conditions hold, ordinary judgment or a spreadsheet usually works. When all five hold, informal reasoning struggles to keep the pieces straight, and decision-making under uncertainty needs structure.
Typical uses include research and development portfolios, capital investments, pharmaceutical pipelines, litigation strategy, and decisions in energy and power, where investments last for decades, and the future is uncertain.
One decision analysis example comes from California, where the California Ocean Science Trust commissioned an analysis of what to do with the state’s 27 offshore oil platforms. The offshore oil platforms case study describes how Lumina compared complete removal, partial removal, and leaving the platforms in place across eight attributes that stakeholders weighted. The case study reports that sharing partial-removal savings with an ocean conservation fund helped win over environmental advocates, and the state legislature then passed AB 2503 almost unanimously.
How does the process work, step by step?
The decision analysis process has eight steps, and most real projects loop back through them as understanding improves. NASA’s systems engineering handbook includes a section on decision analysis that lists trade studies, decision trees, influence diagrams, and utility analysis among its methods, which shows that the approach is standard engineering practice. The numbered list below follows the sequence that most analysts use.
- Frame the decision. State the choice, its scope, and what success means before you build anything.
- Generate alternatives. Look beyond the two or three obvious options, because a creative alternative often beats a refined version of a weak one.
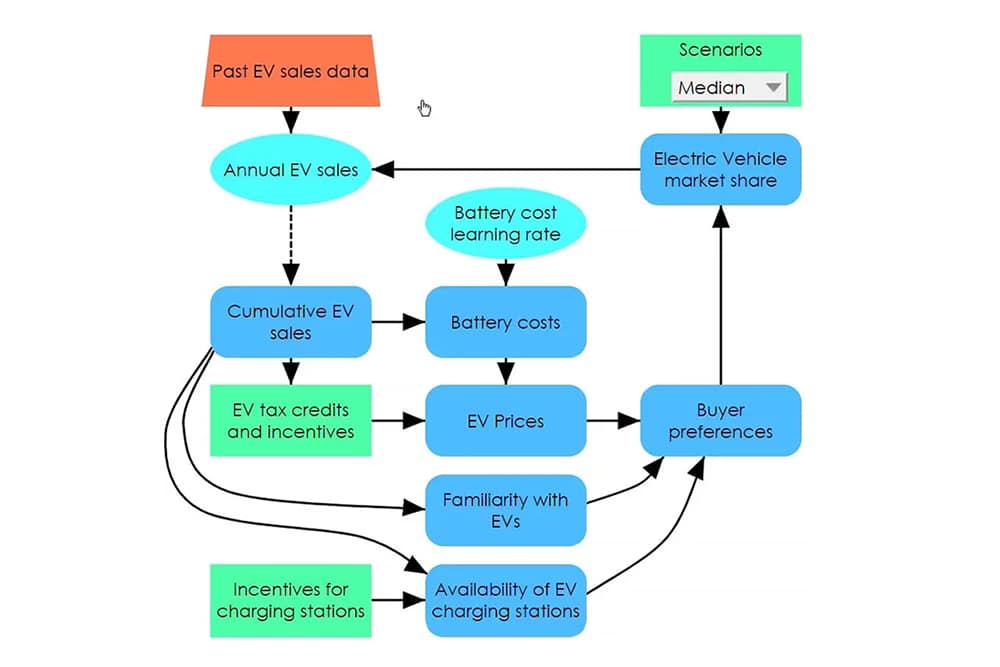
- Structure the problem. Draw an influence diagram that links your decisions, the uncertain quantities, and the objectives.
- Quantify the uncertainties. Express each uncertain input as a probability distribution, using data where it exists and expert elicitation where it does not, then propagate the distributions with Monte Carlo simulation. The risk analysis page covers this step in depth.
- Define values and trade-offs. Convert your objectives into a utility or a score, and weigh competing objectives explicitly with multi-criteria methods.
- Evaluate the alternatives. Calculate the expected value, which is the probability-weighted average of the possible outcomes, or the expected utility of each option.
- Test the result. Run sensitivity analysis to find which inputs could change the answer, and calculate the value of information to see which uncertainties deserve more research.
- Commit and act. Choose, explain the reasoning to the people affected, and revisit the choice when new information arrives.
Steps 4 through 7 separate decision analysis from a pros-and-cons list, because they put numbers on what you do not know and on what learning more would be worth.
Influence diagrams or decision trees?
Both notations describe the same decision, and decision tree analysis and influence diagrams often appear side by side in a single project. Take a drilling choice with two alternatives, drill or do not drill, and one uncertainty, whether the well is productive.
A decision tree shows every path explicitly. The first branch splits into drill and do not drill, the drill branch splits into productive and dry, and each end point carries a payoff. An influence diagram shows the same choice with three nodes: a decision, an uncertain quantity, and an objective, plus arrows that mark which one influences which.
The difference appears as the problem grows. A tree multiplies its branches with every added uncertainty, so ten uncertainties with two outcomes each produce 1,024 end points. An influence diagram adds one node per uncertainty and stays readable.
Trees remain the better choice for short sequences where stakeholders want to follow each scenario, while influence diagrams suit larger models and the task of communicating structure. The two notations complement each other, because Howard and Matheson promoted influence diagrams as a companion to decision trees rather than a replacement.
What is value of information?
Value of information is the most you should pay to learn the true value of an uncertain input before you decide. Return to the drilling choice, and suppose the well has a 30 percent chance of paying $50 million and a 70 percent chance of costing $10 million. Drilling then has an expected value of $8 million, because 30 percent of $50 million is $15 million and 70 percent of $10 million is $7 million.
Now suppose a survey could tell you for certain whether the well is productive. You would drill only the productive wells, so your expected value rises to $15 million, and the gain of $7 million is the expected value of perfect information. No survey, even an excellent one, is worth more than that, and a survey that costs more than $7 million is not worth buying.
The same logic applies to a pilot project before a grid investment or to a demand study before a product launch. Value of information also guides research: if learning an uncertain input would not change your decision, the input is not worth studying.
Decision quality: what makes a good decision?
A good decision and a good outcome are different things. A winning lottery ticket does not make buying it a good decision, and a well-made decision can still end badly because uncertainty remains. Decision analysts therefore judge the quality of the decision, not only the result.
Carl Spetzler, Hannah Winter, and Jennifer Meyer describe six requirements for decision quality:
- An appropriate frame for the decision
- Creative, doable alternatives
- Relevant and reliable information
- Clear values and trade-offs
- Logically sound reasoning
- Commitment to action
Treat the six as a checklist, because a gap in any one limits the quality of the whole decision. The steps above map onto them, and a missing requirement usually shows where the analysis needs more work.
How do decision analytics and decision intelligence differ?
Three terms travel together, and people often confuse them. Decision analysis is the method, decision analytics supplies data-driven inputs to it, and decision intelligence is the broader discipline that connects data, models, and action. The table below compares them.
| Term | What it does | Typical scope |
|---|---|---|
| Decision analysis | Structures a specific choice and recommends an option using probability and utility | Single, high-stakes choices under uncertainty |
| Decision analytics | Turns data into forecasts and other inputs that improve a decision | Any decision where data can reduce uncertainty |
| Decision intelligence | Connects data, models, and action, including platforms for repeated decisions | Routine and unique decisions across an organization |
In practice, the three work together: decision analytics feeds the inputs, decision analysis structures the choice, and decision intelligence extends the approach across an organization. Lumina’s pages on decision analytics and decision intelligence explain each term in more detail.
Where did the field come from?
Decision analysis grew out of statistical decision theory and turned it into a practical method. Ronald Howard at Stanford University gave the field its name in the mid-1960s, and his 1966 paper, “Decision Analysis: Applied Decision Theory,” was the first to use the term. In that year, he also created the Decision Analysis Group at SRI, which became the Strategic Decisions Group in 1980.
Howard Raiffa of Harvard Business School wrote the first book on the subject in 1968, and Howard and James Matheson edited a two-volume collection of papers on its principles and applications in 1983. The Decision Analysis Society began in 1980 as a special interest group of the Operations Research Society of America and now belongs to INFORMS, which has published the quarterly journal Decision Analysis since 2004.
How does Analytica support this work?
Analytica is Lumina’s modeling environment for decision analysis, and its structure follows the process above. You build the model as an influence diagram with decision, chance, and objective nodes, so reviewers can see the logic without reading code. Intelligent Arrays let one model evaluate many alternatives, regions, or time periods at once, without copying structure.
Uncertain inputs take probability distributions, and Monte Carlo simulation propagates them through the model to produce an outcome distribution for each alternative. Built-in tornado charts and importance analysis show which inputs drive the result, and value of information analysis calculates what resolving each uncertainty would be worth. When a decision involves many variables, Analytica Optimizer searches for the best combination, and the page on optimization and solvers explains how that works.
Analytica Cloud Platform lets stakeholders explore a shared model. Readers who want to compare tools can read Lumina’s comparison of decision analysis software.
Further reading
The sources below cover the history, methods, and practice described on this page.
- Raiffa, H. Decision Analysis: Introductory Lectures on Choices under Uncertainty. Addison-Wesley, 1968.
- Howard, R. A. “Decision Analysis: Applied Decision Theory.” In Proceedings of the Fourth International Conference on Operational Research. Wiley, 1966.
- Howard, R. A., and J. E. Matheson, eds. Readings on the Principles and Applications of Decision Analysis. Strategic Decisions Group, 1983.
- Keeney, R. L. “Decision Analysis: An Overview.” Operations Research, volume 30, pages 803 to 838, 1982.
- Keeney, R. L. Value-Focused Thinking: A Path to Creative Decisionmaking. Harvard University Press, 1992.
- Spetzler, C., H. Winter, and J. Meyer. Decision Quality: Value Creation from Better Business Decisions. Wiley, 2016.
- Clemen, R. T. Making Hard Decisions: An Introduction to Decision Analysis.
- Morgan, M. G., and M. Henrion. Uncertainty: A Guide to Dealing with Uncertainty in Quantitative Risk and Policy Analysis. Cambridge University Press, 1990.
Morgan and Henrion’s book treats the uncertainty side of the process in depth, and Spetzler, Winter, and Meyer’s book develops the decision quality requirements in detail.
Frequently asked questions
Is decision analysis the same as decision theory?
No. Decision theory formally studies how agents should choose and how they actually do. Decision analysis applies that theory to specific, real decisions through a practical process of framing, modeling, quantifying uncertainty, and evaluating alternatives. Think of decision theory as the foundation and decision analysis as the practice that builds on it.
What are the main tools of decision analysis?
The main decision analysis methods are influence diagrams and decision trees for structure, probability distributions and Monte Carlo simulation for uncertainty, utility functions and multi-criteria weighting for values, expected value for comparing options, and sensitivity analysis and value of information for testing the result. Expert elicitation supplies probabilities when data are scarce. Most projects combine several of these tools rather than relying on one.
What is expected value in decision analysis?
Expected value is the probability-weighted average of an option’s possible outcomes. In the drilling example above, the option has an expected value of $8 million, even though no single drilling outcome equals that amount. Expected value ranks options under uncertainty without predicting what will happen, and when you want to account for your attitude toward risk, you use expected utility instead. Lumina’s brief explanation of expected value gives more examples.
When is decision analysis worth the effort?
It pays off when the stakes are high, the choice is hard to reverse, the alternatives differ meaningfully, and uncertainty could change the answer. It adds little when the decision is small or easy to undo, or when the answer stays the same whatever the uncertain inputs turn out to be. A quick first model often shows which case you face, and you can add detail only where sensitivity analysis shows it matters.
Can AI do decision analysis?
AI can help with parts of the work, such as drafting a model structure, importing data, and explaining results, but the judgments about alternatives, probabilities, and values remain yours. Transparent models matter here, because you need to inspect what an AI tool wrote. Lumina’s Assista works inside a shared Analytica model, so you can see the assumptions and formulas it creates, and Lumina notes that Assista can make mistakes, so you should check them.
Author
 Max Henrion, PhD, Founder and CEO of Lumina Decision Systems, originated Analytica and has led decision-support work across energy, environment, healthcare, and aerospace. He holds a PhD from Carnegie Mellon University, a Master of Design from the Royal College of Art, and a degree in Natural Sciences from Cambridge University, and is an Adjunct Professor at Carnegie Mellon’s Department of Engineering and Public Policy. He received the 2018 Frank Ramsey Medal from the Decision Analysis Society for lifetime contributions to the field.
See also
Visual modeling

What is Analytica?
How to draw an influence diagram in 3 minutes