From as early as I can remember, I have always wanted to be a scientist. Indeed, while most kids my age were doing normal, healthy kid things on summer afternoons, like engaging in war games or playing with anatomically disproportionate Barbie dolls, I was usually in my secret lab (which was actually a sewing table my father converted to a “lab bench”) looking through my Bendai microscope or mixing chemicals with my Science Fair Chemcraft chemistry set. I distinctly remember on the playground one day, after being bowled over in a dodge ball game, one of my grade school classmates asking me, “You don’t really like sports, do you?” I responded through bloodied lips, “I like to think of science as my sport.” Of course, that admission advanced my standing in the picking order for the next game, as the best were always saved for last.

The Science Fair Chemcraft chemistry set and the Bendai microscope employed in the discovery of new truths in my secret laboratory.
To this day, I still regard my earliest disappointments and proudest moments associated with this obsession with science. The most poignant disappointment occurred when I was eight years old. By this time, I had come to recognize my small microscope as somewhat rinky-dink, not befitting a future Nobel laureate. The lenses were actually made of plastic, and the objective would often slip out of focus. Obviously, this was no way to conduct real science. I needed the truly sophisticated instruments of the trade. And so, in 1975 I asked Santa Claus to bring me a scanning electron microscope. I have long since given up hope. However, encouragement was not far away in a more enduring form.
The following summer I was invited to participate in an experimental summer school that exposed kids with similar interests in science to some classes in biology, microscopy, ecology, and dodge ball skill remediation. (I’ve only recently been informed that this last class was an attempt to normalize us.) On the last day of this heady nerdatopia, the teacher leading the biology class asked me what I wanted to be when I grew up. As you might expect by now, I proudly proclaimed, “I want to be a scientist!” The microscopy teacher, who had sponsored my participation in the program, patted me on the shoulder and added, “Rob doesn’t have to wait to grow up to be a scientist. He already is one.” That singular compassionate comment has persisted in my memory my entire life. It helped to form who I am today.
“Science” is a slight transliteration of the Latin word scientia, meaning “knowledge.” In those early days of my learning about science, I thought science was the accumulation of observations and facts about the world. I could tell you the components of a microscope, how to mount a slide, and how to focus the microscope on the alien worlds down there. Want to know the genus and species of the Quercus rubra in your yard? Well, you probably didn’t, but I could tell you, anyway. Light travels at 299, 792, 458 meters per second. On and on – science was facts. Every new year in school our canonical textbooks began with this banal definition.
We know that science is more than that. I think the kernel for those of us who are fascinated by science is the same. It’s what Richard Feynman described as the “pleasure of finding things out.” I’d state it more strongly, though. It’s the joy of finding things out, that deeply satisfying internal laughter that arises when we see something that is truly cool and causes us to say, “Wow! Isn’t that weird?” Yet, if science remains just the mental stimulation of curiosity about natural phenomena, we’d be stuck with third grade text books that simply list accumulated facts. No real progress would occur. While I think good science retains the childlike curiosity that drives it at the deepest level, ultimately it wants to explain those facts that it observes and understand what causes them to be so. It seeks to pull back the superficial veneer of the directly apparent to reveal the mechanisms that lie beneath. It’s in the pulling back that things get hard, requiring intellectual maturity to advance. As we grow out of the sewing table kinderlabs of childhood, we begin to understand that bona fide facts are very hard to come by, and we usually have to test multiple explanations comparatively for the way things are to make any sense of it all. Along the way, we often combine the pieces of several explanations into hybrids that are only good enough until new information comes along.
The scientific method generally requires that we systematically vary what we conceive of as inputs to an outcome we’re interested in and take note of how strongly each affects that outcome. We also have to accept humbly the notion that what we often assume to be facts are actually uncertainties, untested assumptions, or just plain wishes. That is, we really just don’t know with exacting precision what some explanatory factor is or will be, but we might be willing to describe it with a range of possible values. These two ideas, systematic variation and skeptical treatment of presumptive facts as uncertainties, are hallmarks of the operational approach to science.
Now, consider that you as a decision-maker in business are concerned about creating value for your company. As you have thought about current opportunities to create value with a new business plan, you have conceived of at least two hypotheses (or distinct strategies) about how you might go about doing that.
So, you build a simulation model (in Analytica, of course!) that connects your assumptions treated as uncertainties through the business case logic on some key metric of concern. Maybe this key metric is a net present value of the simulated cash flows that could result from the strategies you have in mind. Your simulation of the two strategies’ NPVs ought to produce distributions that represent the aggregate effect of all the represented factors that affect them. You note at least two characteristics of each bell curve: the central tendency and the dispersion around it.
As a decision maker, you are also a risk manager. Your task is to understand how to control that dispersion in a manner that satisfies your interests; i.e., you generally want to minimize the likelihood of the downside of the bell-shaped curve (if those outcomes are contrary to your preferences) and maximize the likelihood of the upside. However, before you can do this effectively and efficiently, you must understand which assumptions matter most. A powerful type of sensitivity analysis called “tornado analysis” will help you out. Let’s worry about the actual code later *. For now, let’s just focus on the conceptual process of tornado analysis and what it means through some simplified pseudo-code.
- Obtain a list of all the uncertain assumptions in the simulation model.
- Set each of these assumptions to their respective average value.
- Observe and capture the average value of the key metric.
- Setting the first assumption in the list to its 90th percentile value, store the average value of the key metric.
- Setting the same assumption to its 10th percentile value, store the average value of the key metric.
- Calculate the range of the effect of the assumption on the average value of the key metric by finding the difference between the last two recorded averages.
- Repeat steps 1 through 6 through the remainder of the list of uncertainties.
- Reorder the list of the uncertainties according to the decreasing range of the effect in step 6.
- Create a floating bar graph such that each uncertainty in step 8 has a bar length found in step 6, and each bar is centered on the average found in step 3.
More seasoned risk analyst should recognize where I’ve made some relaxed simplifications in this description for the purpose of communicating the gist of the process. Regardless of our degree of experience, though, what we should recognize is that the tornado analysis is systematically revealing the strength of the assumptions, within the range of where we believe the actual outcome will most likely fall, on the variation in the average observed in the key metric. Now you have the building blocks of understanding the explanatory merits of your value theory and a prioritized list of where to focus your attention to manage the outcome you desire. It may not look like science to outsiders, but it actually is.
But there’s a more subtle and vitally important next step. You’ve conceived of at least two ways to get your company to a better position, but you won’t do both. Just knowing the central tendency of the key metric of each and selecting the strategy with the greater one is not merely enough to really manage the risks you face. Again, as a decision maker, you are also a risk manager. Your task is to understand which of those assumptions could cause you regret by taking the initially indicated best course of action (based on the greater central tendency alone) over the next best choice. So, before you begin the process of risk management on a final choice, you need to understand where to improve the precision of the information you possess in your assumptions so that, ideally, you can make an unambiguous choice, if the payoff in improved precision is actually worth the cost of obtaining it.
The work you’ve already done is here to help. Simply lay the tornado charts of each metric against each other in their proper position on the axis of the metric of interest, and note which bars overlap. You will most likely need to reorder the list of the assumptions of one of the tornado charts to match the order of the other to make a logically consistent comparison of factors. Doing this will give you an approximation of where you need to get better information. Since any overlap waves it’s arms at something called value of information, you aren’t that far from knowing just how much to budget to get that information. As a wise decision maker, you won’t waste your time and other resources gathering information on the assumptions that shouldn’t affect your choice. As a scientist, you have discovered the goal of scientific thought: the disconfirming evidence that a hypothesis (and maybe a favorite one, too) is abandoned early enough so that by exclusion you’re just a little closer to the truth.
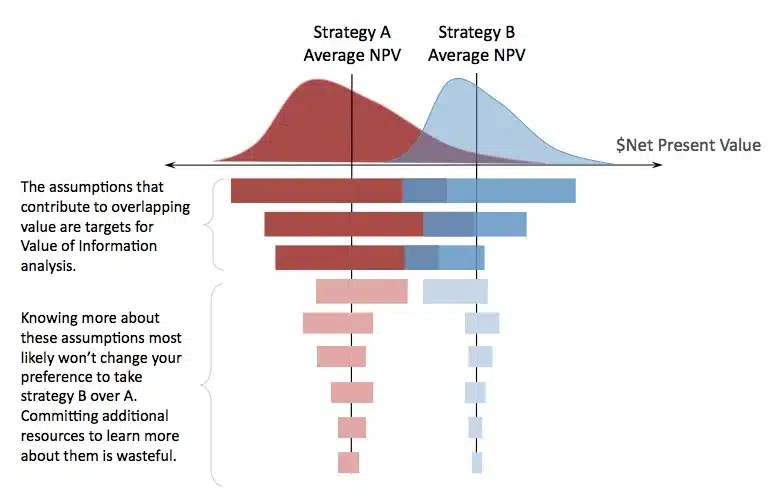
Tornado analyses are like little pocket-sized microscopes for decision-makers who want to manage risk. They show the most important features in the value landscape to focus one’s attention on. Each bar shows how much the quality of information about an assumption contributes to the range in the forecast about the key metric.
It’s not exactly a scanning electron microscope, but I think that’s still pretty cool. Yet, I still dream…
*Analytica makes available several means to create tornado analyses. If you visit the Analytica Docs here, you can read about how to set up a few different examples.