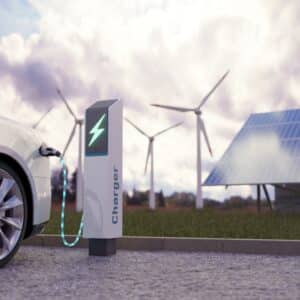
As electric vehicle (EV) sales accelerate, with the US targeting that 50% of new vehicle sales will be EVs by 2030, there is concern about the adequacy of the electricity supply. Will growing electricity demand require more generation capacity and lead to higher electricity prices? The Lawrence Berkeley National Laboratory (the Berkeley Lab) worked with Lumina to explore these questions using FINDER, an economic model of an electric utility implemented in Analytica.
The challenge
A key strategy to reduce carbon emissions is to replace vehicles fueled by gasoline and diesel by electric vehicles powered by electricity from solar, wind, and other low-carbon sources. This transition requires careful planning and operational strategies to ensure grid reliability and affordability. Specifically, the challenge lies in optimizing capacity expansion and dispatch in a way that accommodates variable renewable energy (VRE) sources, manages peak load demands, and effectively integrates DERs.
Why Analytica?
"The FINDER model was originally in Excel and we made the decision to migrate to Analytica mostly because it offered us a very easy and automated way to do scenario analysis. Having n-dimensional arrays in Analytica allowed us to run the same underlying calculations across many different assumptions and characterizations. Before that we had to create a new worksheet in Excel and copy over formulas, which risked incorporating human error and mistakes. We've also taken advantage of Analytica's capabilities to perform stochastic analysis in a project on future retail electricity rates. The optimization capability enabled us to include endogenous capacity expansion and dispatch, and capture important feedbacks between changes in utility sales and peak demand from DERs and changes in forward-looking utility costs and retail rates. James [Milford] has been an outstanding collaborator. Having his expertise and creativity as part of the team would be reason enough to use Analytica!"
Andy Satchwell, Deputy Leader, Energy Markets & Policy Department, Lawrence Berkeley Laboratory
The solution
Researchers at the Berkeley Lab chose to use their Financial Impacts of Distributed Energy Resources (FINDER) model to explore these questions about the effects of EV charging on utility economics. This Analytica model simulates the financial performance of an electric investor-owned utility. It provides a comprehensive approach to forecasting energy demand, integrating distributed energy resources (DERs), and optimizing existing and new generation capacity to meet demand at the lowest cost. It models economic dispatch to meet varying demand, the regulated ratemaking process, and resource planning to invest in new generating capacity to meet growing demand. It evaluates the effects of adding distributed energy resources and electrification, including charging electric vehicles (EVs) and switching buildings from gas to electric heat pumps. It projects the effects on the price of electricity and returns to investors.
FINDER has been developed by the Berkeley Lab for over 14 years. It has been extensively tested and vetted. It has been used for basic research and technical assistance in seven states and two regions.
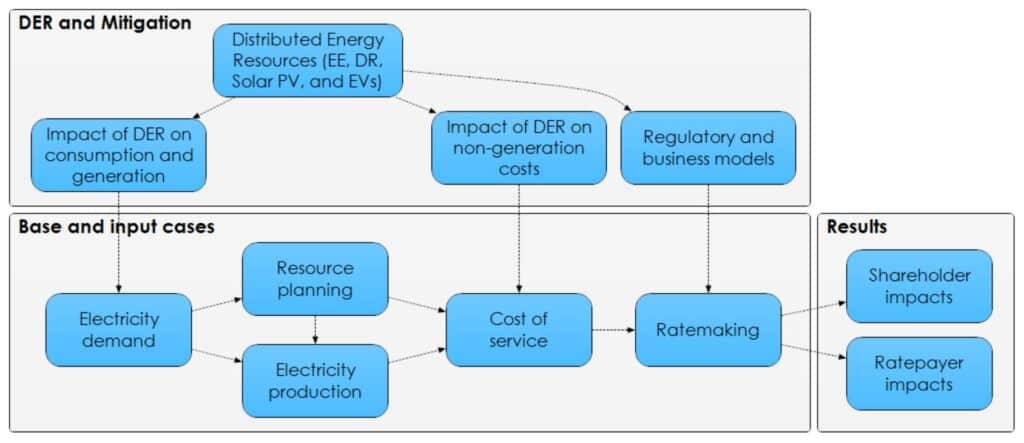
For this project, the Berkeley Lab asked Lumina to extend the model, focusing on capacity planning and EV charging. This project simulated a generic summer-peaking utility that is vertically integrated — i.e. owns most of the generating capacity that it uses. The model simulates changing demand and production by the hour for up to 20 years into the future. It assumes that the state public utility commission will regulate rates to provide the utility with an agreed return on investment.
FINDER employs our Optimizer edition to solve two interrelated problems to minimize costs:
- Economic dispatch selects which types of generating capacity (coal, base gas, gas peaker plants, nuclear, solar PV, wind, and so on) to use to meet varying demand based on which technology has the lowest marginal cost. It encodes the operational constraints of traditional plants on ramp rates and minimum utilization levels.
- Capacity expansion adds new generating capacity and retires old plants to meet changing demand, determining the optimal mix and timing to minimize the cost.
These nested optimizations both use mixed-integer linear programming.
Key insights
These are some of the most interesting results from the study:
- Electricity demand for EV charging in 2040 could vary from 1.5% for low EV penetration (8% of light-duty vehicle stock) to 9% for high EV penetration (56% of LDV stock), or up to 14% for a scenario with higher vehicle miles traveled (VMT) —i.e. EVs are driven further. Because the average vehicle lifetime is around 15 years in the US, there is a delay from EV sales to EV stock in the vehicle fleet. The US target of 50% EVs for new vehicle sales by 2030 is roughly compatible with the 56% EVs of vehicle stock by 2040.

- Managed charging reduces peak load: Peak demand pricing and time-of-use pricing are ways to incentivize charging at off-peak times. This will avoid the high peak impacts (graph on the left below) and levels the demand curve over time, filling in low-demand times (graph on the right below). This leads to higher utilization of generation capacity, which reduces the average cost of energy.
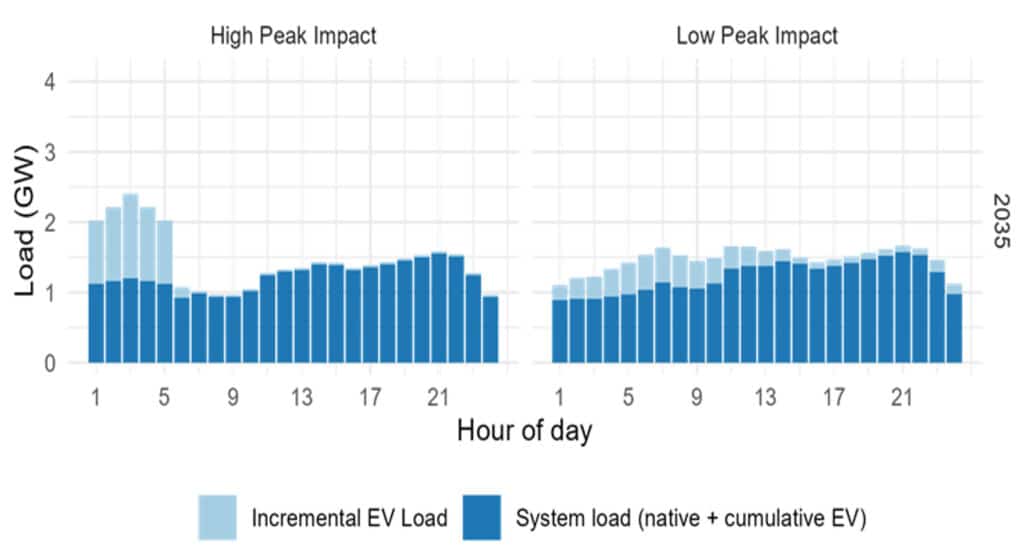
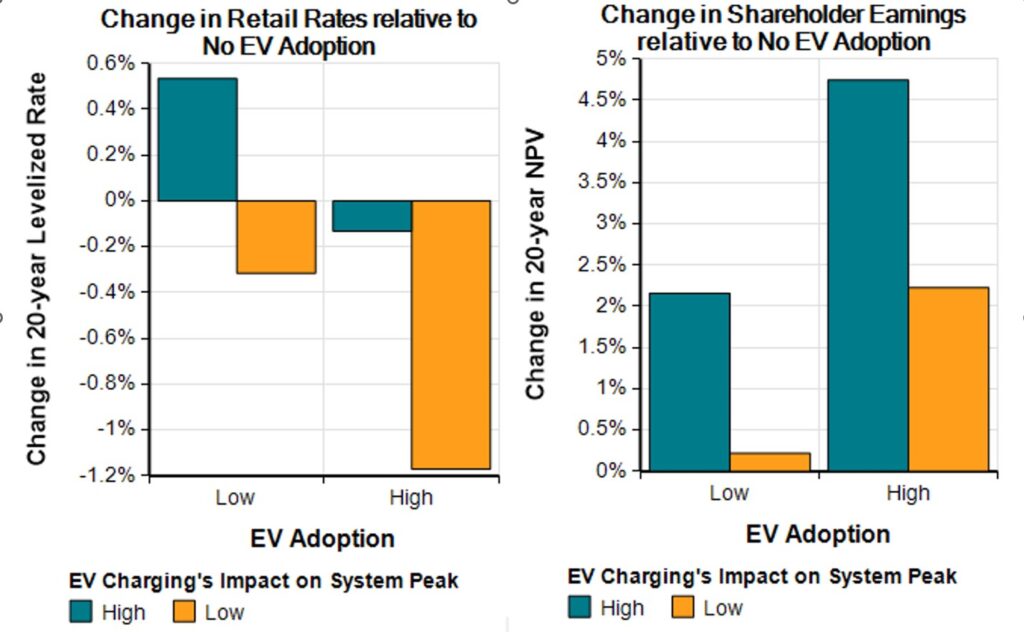
- Large scale adoption of EVs with managed charging can reduce rates and increase utility earnings: For the high EV adoption scenario (EVs comprise 56% of vehicle stock by 2040) and low peak impact (managed charging), FINDER projects small positive changes: a reduction in retail rates by about 1.2%, and an increase in utility shareholder earnings by 2.2%. If EV charging has a high impact on system peak (rather than leveling the load curve), EVs would increase shareholder earnings much more. The reason is that the utility would build more generating capacity to handle those peaks on which they get a financial return (allowed by the public utility commission). It would also reduce overall utilization resulting in higher electricity costs to ratepayers.
Customer
This FINDER model was developed with support from the US Department of Energy, to assist utilities and other stakeholders evaluate the effects of future scenarios and policies on electric utilities and their customers.
Authors


Berkeley Lab Authors – Photos @ 2010 The Regents of the University of California, through the Lawrence Berkeley National Laboratory.
For more
Supplemental information on the utility financial and operational characterization, EV deployment assumptions, and modeling approach, including generation capacity expansion and dispatch logic is available at: https://emp.lbl.gov/publications/quantifying-financial-impacts.
Berkeley Lab researchers developed ranges of forecasted growth rates for cost-related rate drivers (e.g., transmission, distribution, generation, fuel plus purchased power, and operations & maintenance) and non-cost related rate drivers (e.g., retail sales, peak demand, and customers). Lumina updated FINDER to include these probability distributions and estimate the impact of each driver on the growth in retail electric rates, with findings available at: https://emp.lbl.gov/publications/disaggregating-future-retail

