What is Analytica software?
Analytica is a visual software environment for building, exploring, and sharing quantitative models to help people make effective decisions. The experience of using it is very different from its usual alternatives: spreadsheets and scripting languages like Python and R. These are the key features that will help you save money and time.
“Everything that’s wrong with the common PC spreadsheet is fixed in Analytica.”
 Review
in PC Week
Clarity: influence diagrams
Build, navigate, and present your models with intuitive influence diagrams. Distinguish decisions, uncertainties, and objectives by node shape. Clarify dependencies with influence arrows.
For more, see Visual modeling and What is an influence diagram
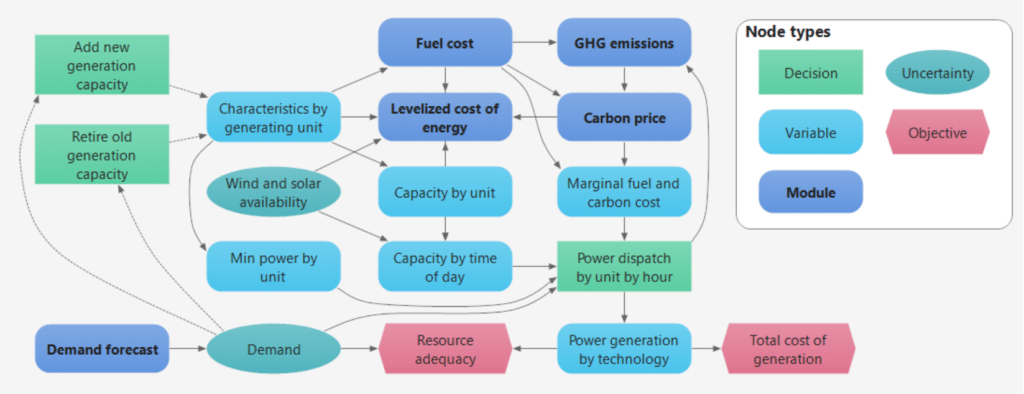
“Analytica is so much easier to use than spreadsheets. The brilliant thing is its influence diagrams. First you build a model graphically, and then fill in the details.”

Fisheries and Oceans Canada, Winnipeg, Canada
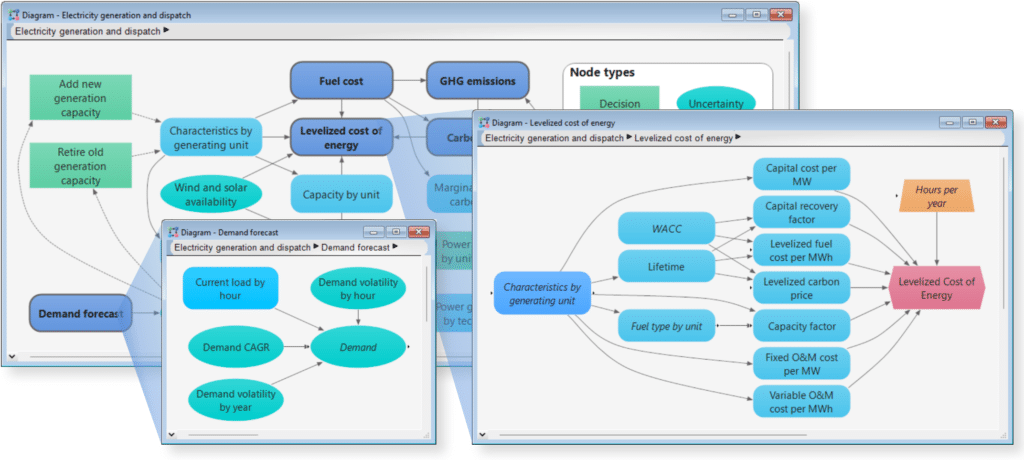
Scalability: module hierarchy
Easily manage models that are too complex for spreadsheets. Organize large models as a hierarchy of comprehensible modules.
“We liked the fact that Analytica allows models to be graphically depicted as nested modules so that complex networks can be represented at different levels of detail. This enhanced model transparency and would not have been possible with a spreadsheet or computer code.”

Duke University, North Carolina
Flexibility: intelligent arrays
Change time steps and time horizons, add products, geographic regions, or scenarios. Intelligent arrays make it easy to work with multidimensional data by handling these changes automatically.
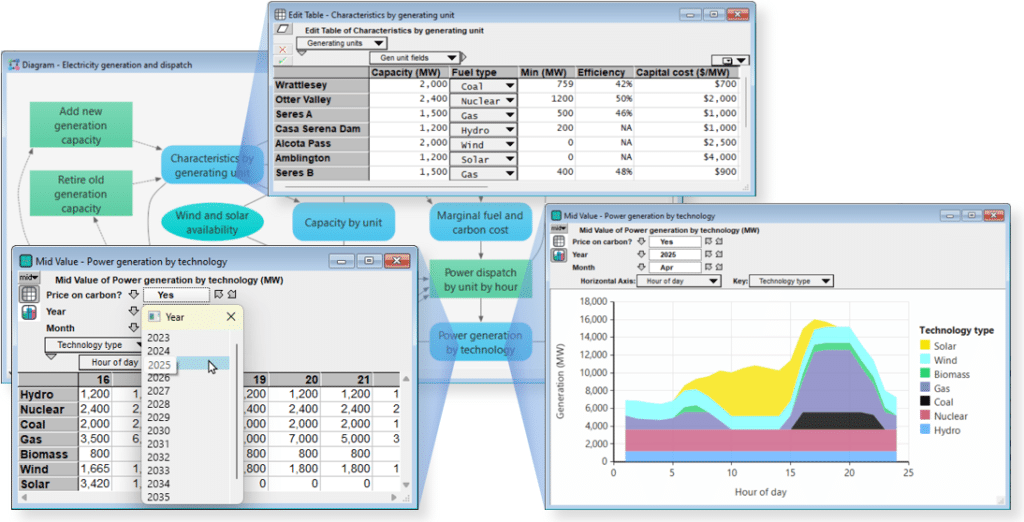
“Unlike spreadsheets, the World has more than two dimensions. That’s why you need Analytica.”

President of ProbabilityManagement.org and author of The Flaw of Averages
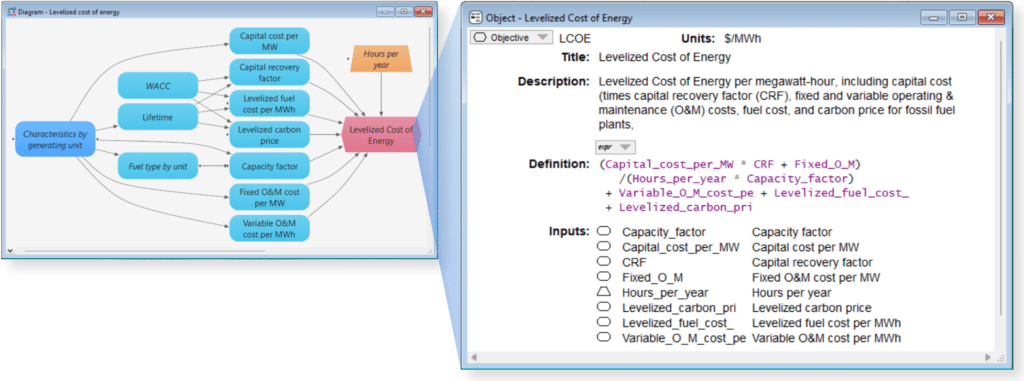
Transparency: integrated documentation
Each variable includes units, description, inputs, outputs, and more. This transparency helps you and your clients understand the assumptions and trust the results.
“What you’re looking to do is understand not only the numerical results, but the relationships that generate the results.”

in Dataquest
Risk & uncertainty: Monte Carlo
Explore multiple scenarios. Quantify risk and manage uncertainty with efficient Monte Carlo simulation. Use intelligent sensitivity analysis to discover which uncertainties really matter and why.
For more see Embrace risk & uncertainty.
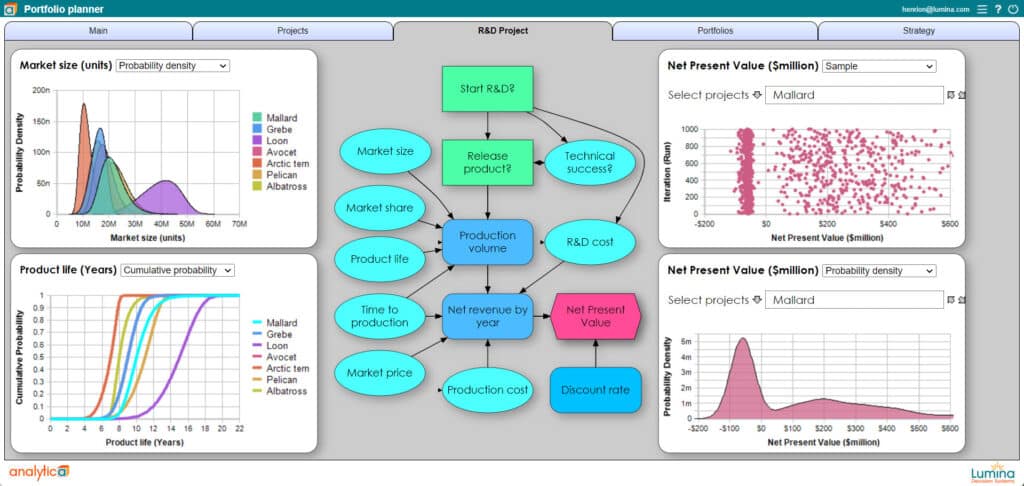
“Within its chosen domain — uncertainty propagation through influence diagram models — Analytica is by far the easiest and best tool that we have seen.”
Tony Cox, PhD
Boulder, Colorado
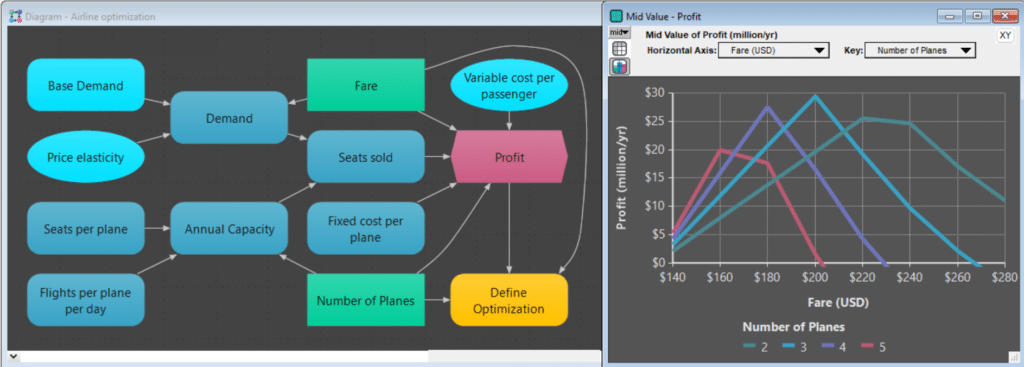
Power: optimization
Analytica Optimizer finds the best decision strategy. It formulates complex problems automatically. It lets you plug in the world’s most powerful solver engines with thousands of decision variables and constraints.
For more see Analytica Optimizer.
“Analytica is hands-down the best platform out there for optimization problems.”

Guidehouse Consulting, Boulder, Colorado
Ease and reliability: flow architecture
With R, Python, and other scripting languages, you need to be a programmer — or hire one. Analytica’s intuitive declarative language lets you build models with the skills you already have. Its Flow Architecture manages evaluation automatically – so you don’t need to worry about managing the flow of control and its attendant bugs.
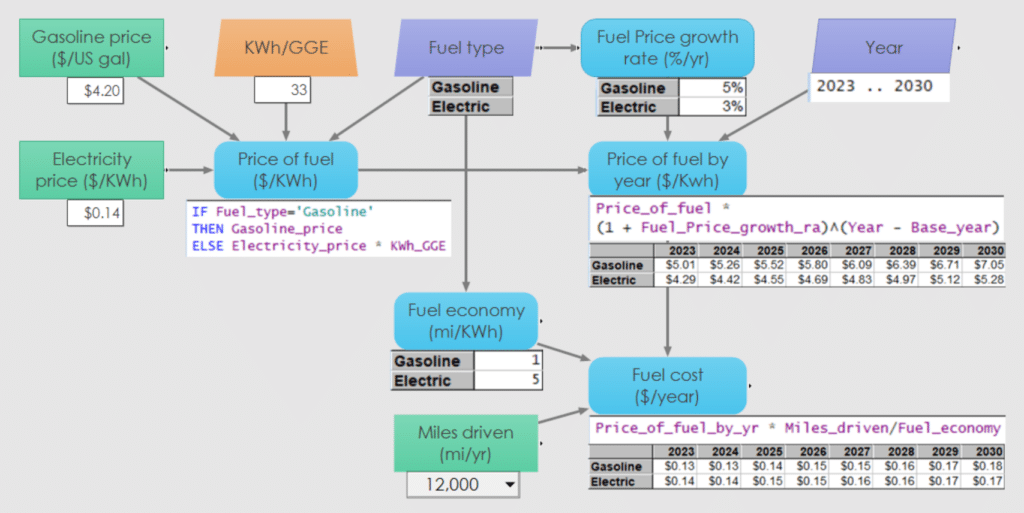
“The amount of time, headaches saved in spreadsheets and Python scripts is worth the learning curve.”

Technology Lead at Mindsets

Collaboration: Analytica Cloud Platform (ACP)
Deploy models instantly onto the web to share with collaborators and decision makers using the Analytica Cloud Platform.
“Analytica rends the veil that has kept business managers from collaborating with analysts on complex business models.”

Chief Executive Officer at Homestead Bioscience
Elegant integration
Analytica is an integrated platform, designed from its inception to combine these critical features into a coherent and elegant whole.
- The influence diagrams automatically reflect the dependencies among variables and also the basis of the flow architecture.
- Uncertain values are represented as a random sample over the Run index, which is just another dimension, so you get the full power of intelligent arrays to display and analyze probability distributions.
- Dynamic models allow feedback loops over the Time index, which again is just another dimension supporting intelligent arrays.
- The Optimizer fully supports intelligent arrays over Time and Run Indexes enabling powerful dynamic and stochastic optimization.
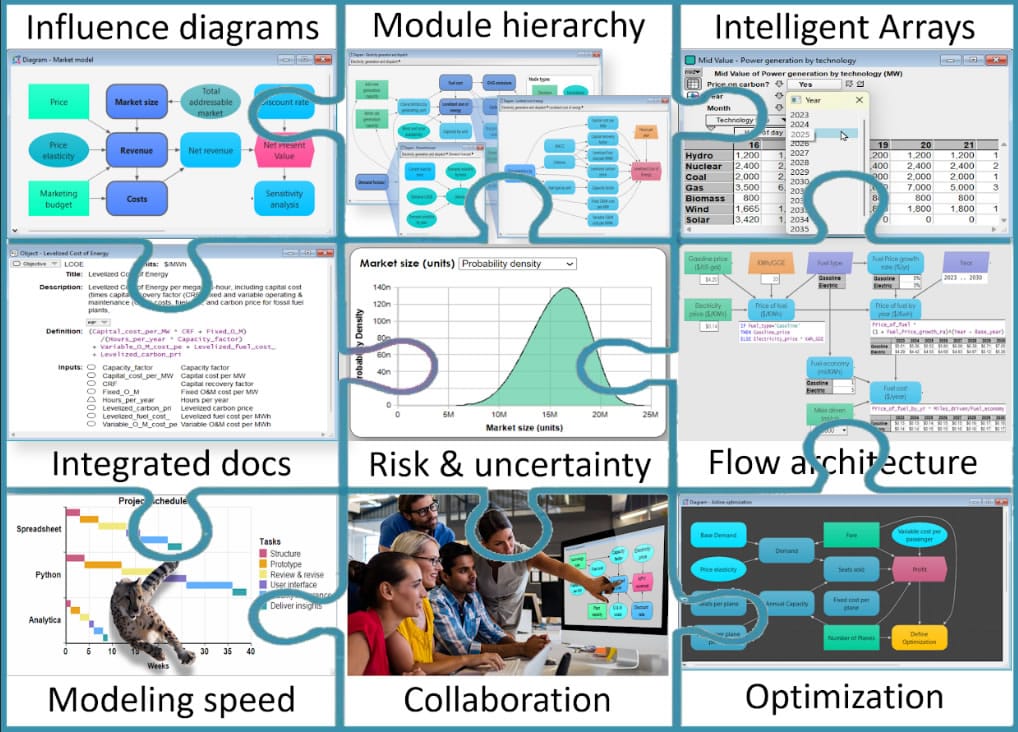
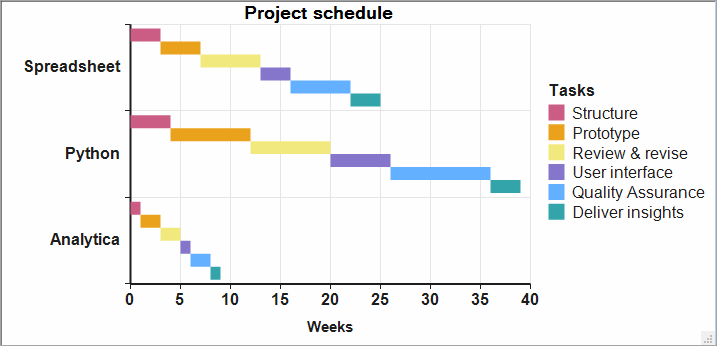
Speed: Accelerated modeling
Together, these features make it many times faster to build—and extend—models in Analytica than spreadsheets or programs in Python or R. Analytica model files are 10 to 100 times smaller than equivalent Excel files—and correspondingly easier to build, explain, and maintain. The speed and agility of development makes modeling a quite different experience, more satisfying and rewarding for analysts and their clients.
For more see Productivity: making modeling fast & fun.
“I estimate that the time I spend writing Analytica models is one quarter to one half of that devoted to similarly complex spreadsheets.”

Software Review, ORMS Today

