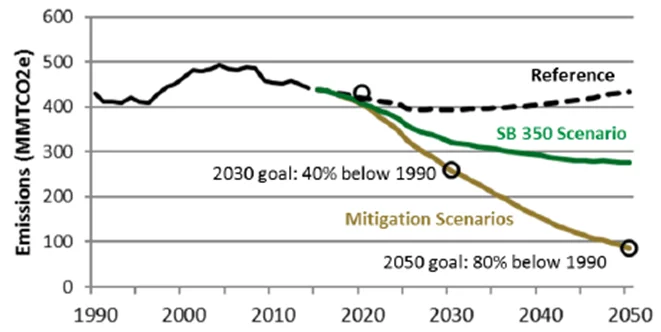
 California is a leader among US states in its policies to reduce greenhouse gas (GHG) emissions. Its per capita emissions at 10.8 tons CO2 (2016) are about half the US average of 20.3 tons. In 2006, the landmark California Global Warming Solutions Act (AB 32) established a target of reducing state GHG emissions back down to its 1990 level by 2020, a 13% reduction from its 2004 peak. California has already met this 2020 target four years early- in 2016.
In 2018, Governor Jerry Brown signed a new bill, SB100, with a more ambitious target for 2030 – to reduce emissions by 40% below 1990 levels. The strategy includes increasing electricity production to 50% renewables, reducing gasoline and diesel use in vehicles by 50%, doubling energy efficiency in existing buildings, and zero net energy (ZNP) in new commercial buildings, all by 2030, inclusive of ZNP for new residential buildings by 2020. SB100 also requires 100% of the state’s retail electricity to be carbon-free by 2045. Governor Brown also added an executive order B-30-15 that calls for zero net carbon emissions from all sectors by 2045. California ambitiously plans to reduce GHG emissions by 80% by 2050.
The problem
How practical is California’s ambitious emissions targets? Or will the cost be exorbitant? Like other states and countries, most of California’s emissions arise from combustion of fossil fuels for transportation, generation of electricity, and for buildings and industry. The balance arises from agriculture and changes in land use – plus, the massive wildfires in 2017 and 2018 released enormous amounts of CO2 into the atmosphere.
Unlike most other states and countries, California already uses almost no coal, so there is no scope to reduce emissions by switching from coal to natural gas. It has a cap-and-trade scheme that requires buying emissions allowances to burn fossil fuel, as a way to incentivize shift to low-carbon options. It has adopted a plethora of other regulations and incentives to encourage energy efficiency and emissions reduction. The big questions are-Will it be adequate? At what cost?
Why Analytica?
Energy + Environmental Economics (E3), a consulting firm in San Francisco, created an early version of PATHWAYS in Excel. But it soon became clear that a spreadsheet was impractical for dealing with so much data and so many dimensions. The E3 team liked Analytica’s influence diagrams to help them visualize the connections between variables and flows through the model. They found Analytica really convenient in the way it handles arrays with multiple dimensions. They also liked the ability share models with the client as a self-contained model file combining model and data. Their clients at California Air Resource Board found it much more accessible than other tools that required them to set up environments to run model code.
The solution
PATHWAYS is an Analytica model that simulates the effects and costs of alternative decarbonization scenarios to enable California to meet its GHG reduction targets for 2030 and beyond, up to 2050. The model encompasses the entire California economy with detailed representations of the buildings, industry, transportation, and electricity sectors, and interactions among them. It uses an hourly model of the electricity supply and demand and models adoption of energy-efficient and low-carbon technologies including turnover of stocks and replacement of vehicles, appliances, and buildings. The model is updated frequently to reflect new data and changes in environmental policies, technology performance and costs, fuel prices, and other factors.
Energy + Environmental Economics (E3), a consulting firm in San Francisco, developed the PATHWAYS model in Analytica, starting in 2008, for the California Air Resources Board (CARB) and other California state agencies. The most recent study explored ten scenarios to achieve the updated policy goals and compared their effectiveness and costs. It has some remarkable conclusions about the preferred “High Electrification Scenario”:
“The net cost of transforming the state’s energy economy to a low-carbon system is relatively small. Fuel savings from reduced consumption of gasoline, diesel and natural gas help offset the higher capital costs associated with low-carbon technologies. The estimated 2030 total direct cost, (excluding health and climate benefits), to meet the state’s climate goals range from a savings of $2 billion per year to net costs of $17 billion per year, with a base case result of $9 billion per year in 2030.
This amount is less than the recovery costs associated with one large natural disaster, such as the recent 2017 wildfires in Northern California. Put differently, the estimated 2030 cost of reducing statewide greenhouse gas emissions by 40 percent is likely to range from a savings of 0.1 percent to costs of 0.5 percent of California’s gross state product. The societal benefits of the GHG reductions achieved are likely to outweigh these costs.”
Deep Decarbonization in a High Renewables Future: Updated Results from the California PATHWAYS Model, California Energy Commission, June 2018 | CEC-500-2018-012.
The high electrification scenario
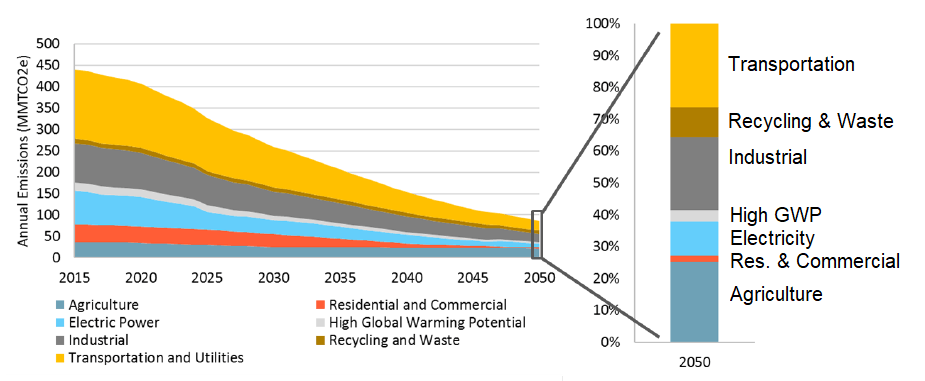
This 2018 study by E3 for the California Energy Commission compared 10 Mitigation scenarios for comparison with a Reference or business-as-usual scenario. Among the mitigation scenarios, they found that the high electrification scenario was the best way to achieve deep carbonization at low cost and low technology risk, compared to alternatives. Improved energy efficiency and low-carbon electricity are essential elements, but insufficient by themselves without adopting electric vehicles to displace gasoline and diesel plus using electric heat pumps to displace natural gas for heating buildings.
They estimate that biofuels are unlikely to be available in sufficient quantities for transportation or heating without incurring additional emissions from land-use changes from converting large areas to grow energy fuels, beyond some biomethane by pipeline primarily for industrial use. These findings confirm a landmark study by E3 using an earlier version of PATHWAYS published in Science Journal in 2012, which found a high level of electrification was key to achieving deep decarbonization for similar reasons.
Marginal abatement costs
The study analyzes the effect of a variety of options in terms of their cost-effectiveness of carbon mitigation using a Carbon Abatement Cost Curve [also link to Lonnie’s blog on abatement curves]. This curve orders carbon mitigation measures from least to most expensive in terms of dollars per ton of CO2e abated for the High Electrification Scenario. It shows that energy efficiency (EE, Smart Growth) actually reduces cost at up to $600 per ton CO2e abated, as do zero-emission vehicles (ZEVs) and heat pumps. It finds that biofuels, power to gas, and hydrogen trucks are among the more costly measures.
The incremental cost per ton of GHG savings for the High Electrification Scenario measures relative to Reference Scenario measures (2016 $/ton CO2e). Costs are based on a total resource cost assessment, net of fuel savings. Cost estimates are highly uncertain and do not represent a cap-and-trade market price forecast. Incentives are not reflected in the cost estimates. Emission reductions do not add up precisely to the total GHG reductions in the High Electrification Scenario because of interactive effects between measures. Source: E3
Uncertainty in scenario analysis
It is reassuring for Californians to read that the base case cost of meeting the 2030 target is “relatively small,” about one quarter of a percent of California’s gross state product per year — even ignoring the effects of reducing air pollution on human health and environmental damage.
The study is also noteworthy in reporting the uncertainties explicitly, giving a range of cost up to a half percent and down to a net saving of a tenth of a percent of GSP. In other words, there is a possibility that these dramatic changes could actually result in net cost reduction. This range reflects a large number of uncertainties, including how rapidly costs continue to come down on solar, wind, batteries, electric vehicles, and other technologies, and the value of fuel savings due to uncertainty about the future prices of fossil fuels.
It identifies two particular risk factors: Costs could be lower if lower-cost and sustainable biofuels become available. They could be higher if it proves more expensive to retrofit buildings for electric heating to replace gas.
Customers

Authors
Energy + Environmental Economics (e3) consulting firm developed PATHWAYS for CARB and other California state organizations. E3 has conducted a series of studies, with support from Lawrence Berkeley National Laboratory (LBNL), using the model to evaluate future scenarios and policies.


For more
- Deep Decarbonization in a High Renewables Future: Updated Results from the California PATHWAYS Model, California Energy Commission, June 2018 | CEC-500-2018-012. Energy commission releases new e3 report on Pathways for CA to achieve its long-term GHG reduction goals.
- In 2012, Ethree used PATHWAYS for the landmark study, The Technology Path to deep GHG emissions cuts by 2050: The Pivotal Role of Electricity, Science, James H. Williams, Andrew DeBenedictis, Rebecca Ghanadan, Amber Mahone, Jack Moore, William R. Morrow III. Science , 06 Jan 2012: Vol. 335, Issue 6064, pp. 53-59
- E3’s analysis is also featured in a new article in the IEEE Power and Energy Magazine, On the Path to Decarbonization, July/August 2018 special issue, authored by E3’s Amber Mahone, Dr. Zachary Subin, and Dr. Ren Orans along with colleagues from National Grid U.S. and Siemens. The article compares electrification impacts in California and the Northeast United States.
- Model for deep decarbonization, Pathways by e3.


