 The US Department of Energy (DOE) funds a huge range of research and development (R&D) projects in innovative energy technologies. Topics range from energy efficiency, solar and wind power, electricity storage, biofuels, hydrogen, and geothermal, to carbon capture and sequestration. DOE-funded projects have helped drive the dramatic reduction in costs of solar and wind over the last 20 years. In doing so, they’ve helped make it economically practical to transition to lower carbon energy systems that are essential to address the challenges of climate change.
NREL led the design and development of the Stochastic Energy Deployment System (SEDS) as an Analytica model. SEDS provides comprehensive coverage of the US energy and economic systems to enable it to simulate the adoption of each technology based and effects. It projects the uncertain effects of each R&D portfolio not only on performance and cost of each technology, but on its adoption curve, and resulting effect on the cost of energy, and GHG emissions. It uses Monte Carlo simulation to model the uncertainty in the outcome of each R&D project as a function of funding level, and to project its effects.
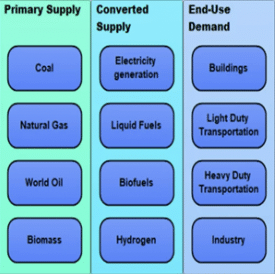
James Milford at NREL coordinated a distributed group of model developers, with teams at six National Labs (including NREL), plus Lumina Decision Systems. Each team designed and developed one or more of the modules, which were integrated for analysis at NREL. The top level view of SEDS (below) shows the main modules. Primary supply covers the original sources of energy. These fed into Converted supply. Finally, End-Use Demand models the consumption of energy in Buildings, Light and Heavy Duty Transportation, and Industry. The MacroEconomic model drives growth and demand, along with effects on energy prices.
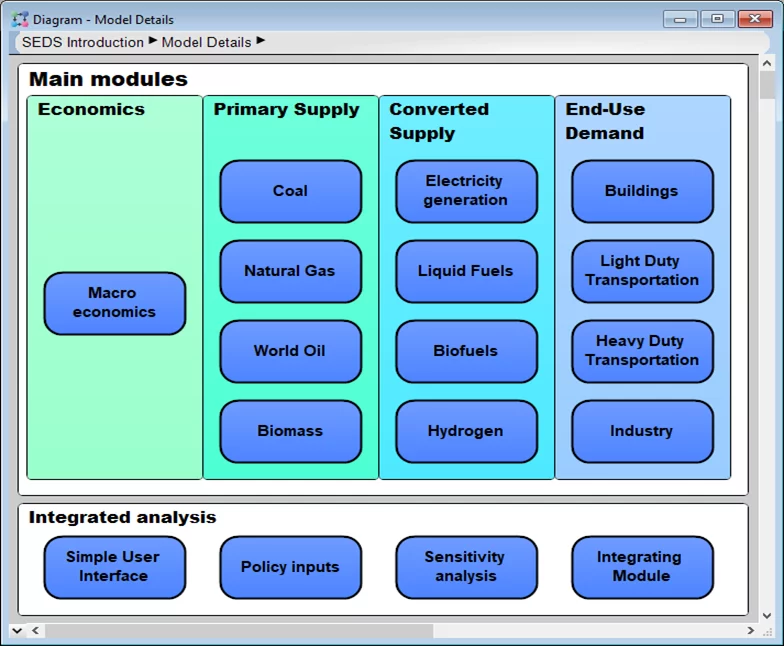
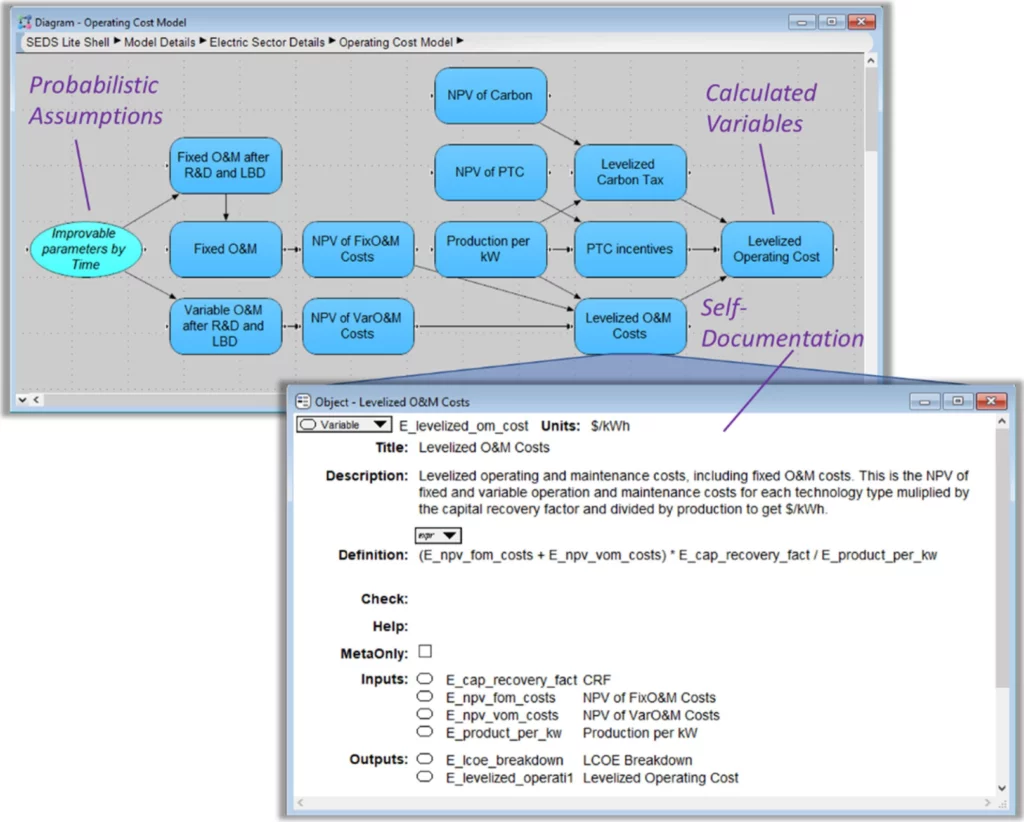
Each module is organized as a hierarchy of submodules, each with an influence diagram showing the relationships among the variables. Each variable has an Object view including units, and description and definition.
SEDS runs from 2005 to 2050 using an annual time step to explore long-term effects. The main structure relies on a single national region for the US, with regional detail for selected modules such as buildings. It uses logit models to project market share among competing technologies based on their relative costs or values, including non-cost attributes. The parameters were calibrated by comparison of historical data combined with expert judgment.
SEDS projects the uncertain effect of R&D funding levels on the technical success of each project, and consequent market adoption and effect on energy costs and GHG emissions. A sister project to SEDS obtained estimates of the uncertain effects of each R&D project on the cost and performance of each technology using structured interviews (expert elicitation). The risk teams interviewed 3 to 9 experts – scientists and engineers from national labs, universities and industry with a deep understanding of the technology and economics underlying R&D in each field. For each parameter, such as efficiency, or unit cost, the experts assessed the probability of any significant advancement, and 10th, 50th, 90th percentiles for two points in the future, usually 5 and 15 years into the future. Performance was estimated for three levels of DOE funding, the current target level, zero further funding, or double the target level. In some cases, experts also estimated future learning rates, that is, percent cost reduction per doubling of cumulative capacity. The elicitation process estimated effects of R&D on 36 technologies, with 3 to 9 experts per technology, and a total of 167 experts. The elicitation protocol was designed to minimize biases, such as the common tendency to overconfidence. The project was designed and managed by Thomas Jenkins of NREL and Max Henrion from Lumina.
In addition to the uncertain effects of R&D funding, SEDS explicitly treats uncertainty on a variety of other kinds of variable, including future fuel supplies and costs, GDP and demographic growth. It allows exploration of a variety of government policies, including subsidies for biofuels, production and investment tax credits for renewables, carbon cap or tax, renewable portfolio standards, and more.
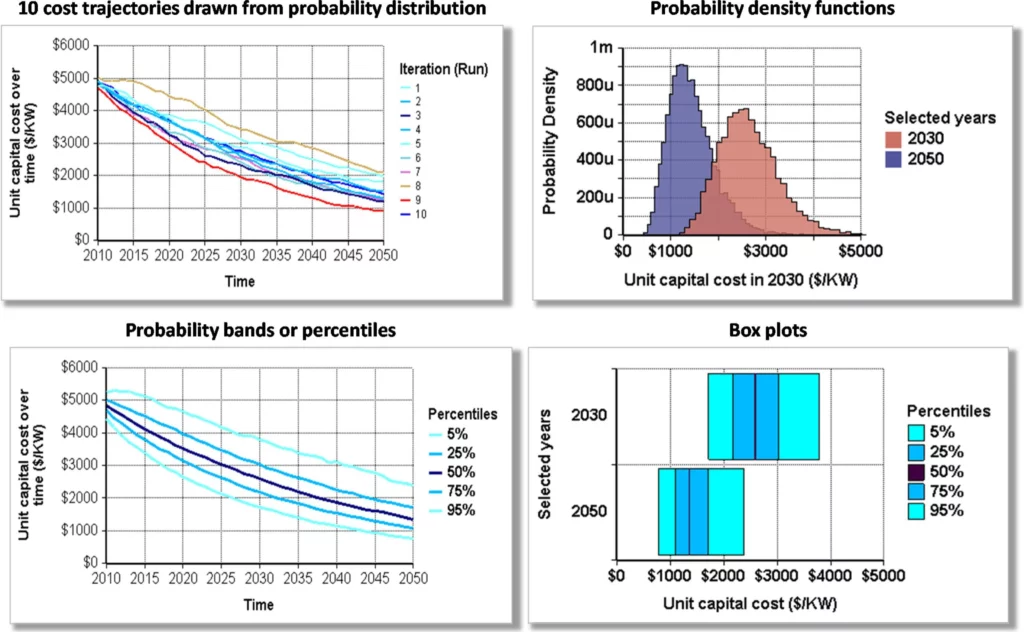
The team developed a series of displays to show uncertainty and tutorials explain the effective use of the model.
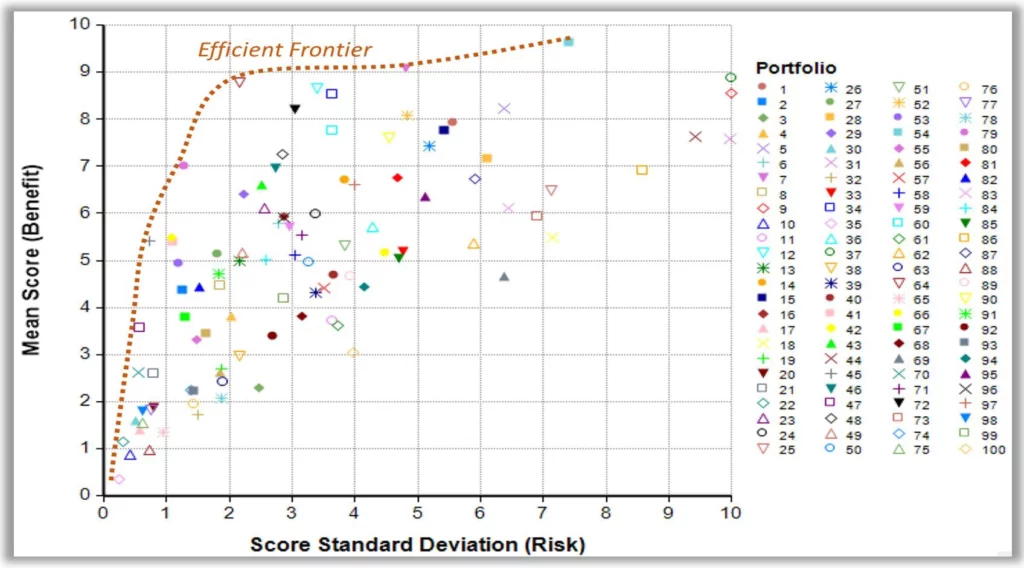
SEDS provides a variety of ways to display and explore the effects of R&D portfolios and to guide in the selection of projects. One display is a Markovitz-style efficient frontier analysis that compares each project by plotting mean score (expected net benefit) for each portfolio against the risk (standard deviation) in outcome.

The sponsor and client for SEDS was DOE’s Office for Energy Efficiency and Renewable Energy under the leadership of Samuel Baldwin, Chief Science Officer, along with Darrel Beschen and Michael Leifman.
SEDS was built as a national collaboration led by NREL with teams of modelers at five other national labs and Lumina Decision Systems.