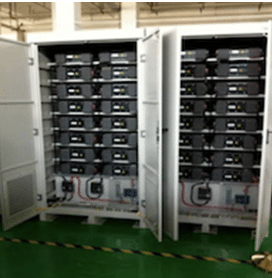
 Energy storage technologies, including batteries and thermal cooling, shift electrical power loads to off-peak times. This reduces the cost of power and the need for expensive new peaking plants.
The California Energy Commission (CEC) asked E3 Consulting to built an open-source model to help large California utilities (PG&E, S. California Edison) and other stakeholders evaluate the cost-effectiveness of these load shifting technologies for consumers and utilities.
The challenge
Several energy storage technologies are emerging that shift electrical power load from peak to off-peak times, reducing the cost of power and the need to build expensive new generating capacity.
These Permanent Load Shifting (PLS) technologies include batteries, thermal storage (e.g. making ice at night to cool buildings during the day) and process shifting. The California Public Utilities Commission (CPUC) asked Energy and Environmental Economics, Inc. (E3) and StrateGen Consulting to create a model to help the CPUC, the large California investor-owned utilities (PG&E, SCE, and SDG&E) and others to evaluate the potential of PLS.
The consultants used a collaborative process with workshops, interviews and meetings with stakeholders to develop an open-source tool. The model was required to evaluate the cost-effectiveness of PLS methods, including benefits to the power grid, integration with renewable sources, and savings to consumers.
Why Analytica?
E3 wanted a modeling platform that made model structure and assumptions transparent and could be easily used by a variety of stakeholders.
“Even with a number of analysts experienced in Excel with VBA, we have found Excel/VBA models time consuming to update and debug for each new project with slightly different requirements. As the VBA modules became more complex, they became difficult to document and transfer between analysts.”
“Finally, once a model relies heavily on VBA, it severely limits its transparency and the opportunity for review in the public review processes that are central to regulatory oversight and policy development in the energy utility industry. We took a risk choosing Analytica over Excel/VBA for the first time in the Permanent Load Shifting Cost-effectiveness Evaluation, but were very glad we did”
– Eric Cutter, Senior Consultant
“When we decided to expand the scope of our analysis for this project, Analytica’s Intelligent Arrays™ allowed us to make simple changes that propagated throughout the model. The time savings offered by Analytica relative to Excel was tremendous”
– David Miller, Lead Analytica Modeler
The solution
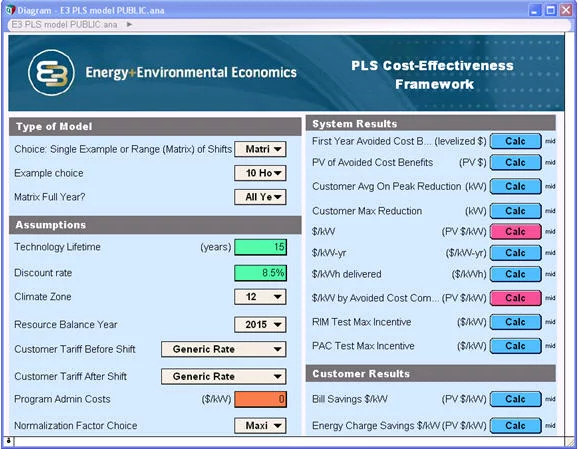
E3 used Analytica to develop a publicly available tool to explore the value of PLS technologies. With 8,760 hourly PLS system impacts, customer load data, retail electricity rates and avoided cost data as inputs, the tool estimates costs and benefits over the life of the PLS technology.
It offers users a transparent and intuitive user-interface which allows them to adjust key assumptions, such as the lifetime of the PLS technology, customer tariff rates (before and after shift), climate zones, and the discount rate.
“With one day of training and a few hours of support from Lumina, we delivered a polished model in one month that summarized the economics for several technologies, case studies, customer types, operational profiles, rate schedules and locations. Expanding the model to include additional technologies, rates, scenarios etc. was extremely easy as compared to adding rows, columns, charts and VBA arrays in Excel. Stakeholder feedback on the model and presentation of results in public workshops was overwhelmingly positive”
– Eric Cutter of E3
“One area in which Analytica proved to be especially useful was in our analysis of utilities tariffs. Tariffs are diverse and complex, with features such as inclining block rates, time-of-use energy and demand charges, critical peak pricing rates, and various other customized conditions specific to a particular rate or utility. “
“With Excel, modeling tariffs accurately becomes convoluted quickly. The influence diagram interface of Analytica helped us to adopt simple rules that could be applicable to all tariffs and significantly reduce the customization necessary for each tariff.”
– David Miller of E3
The tool estimates both system wide results, such as the present value of grid benefits, and customer specific bill savings. The model is highly interactive and supports rapid changes to key assumptions to explore their effects on key outputs.
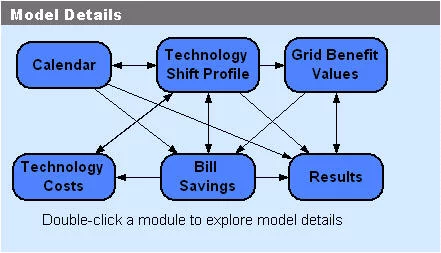
It displays visual influence diagrams that allow users to explore the details of the model, as shown below.
Results
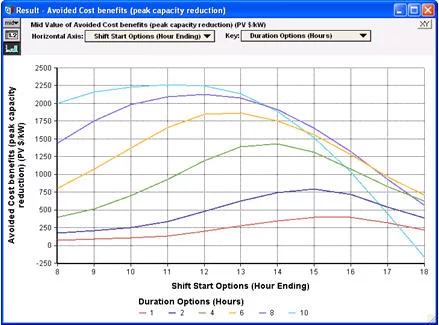
The model allows users to interactively explore the effect of changing input assumptions, such as what hour the load shifting starts and the duration of the load shift.
As shown in the graph below, using the new PLS cost-effectiveness model, the lifecycle value of the grid benefits of PLS technologies (over a 15 year project life) ranges from $500 to $2500 per peak kW reduction, depending on the number of hours the PLS system can shift load, and what hour the load shifting starts
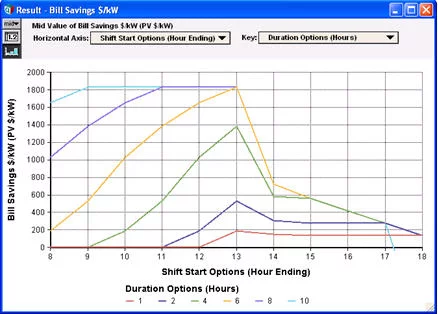
The PLS tool presents the bill savings to the customer. The figure below shows the bill savings for 66 shift profiles under the generic rate.
As can be seen, the baseline profile peaks at about 12 noon. Thus, shifts that start after noon do not accrue benefits for demand charge reductions and tend to have lower total bill savings.
E3 used the PLS Analytica model to evaluate the cost-effectiveness of PLS to utilities and consumers in the California electricity markets.
The utility companies are using these results to help decide the scale of their PLS programs as part of their demand-response plans.
Authors

David Miller, E3

Eric Cutter, E3
For more
This model was built by Energy, Environmental and Economics Consulting Inc. For more information on the CPUC study or to download a copy of the open-source PLS cost-effectiveness model please visit the project webpage.

