Recent advancements in cold-climate heat pump technology have proven their effectiveness in heating homes even in areas with harsh winters. However, there’s been less research into whether relying solely on a heat pump is the most cost-effective heating method.
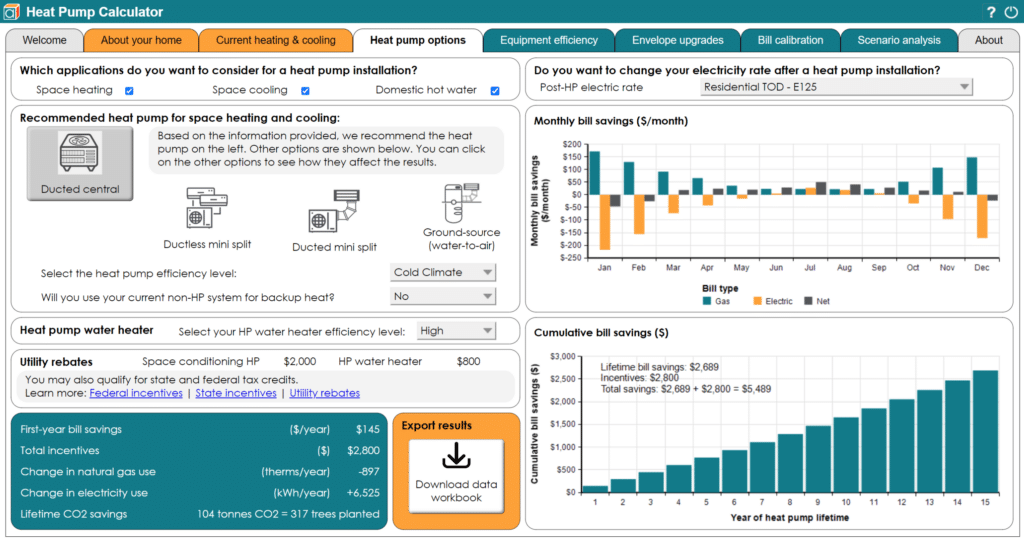
Using the latest version of Lumina’s Heat Pump Calculator, tailored for the municipal utilities in Fort Collins and Longmont, CO, we analyzed the impact on utility bills, energy use, and greenhouse gas emissions of both cold-climate heat pumps and hybrid systems combining heat pumps with furnaces. Our findings indicate that for the specific climate and utility rates in this Colorado region, hybrid systems are more economical than using heat pumps alone for space heating.
Further discussion of our findings is organized into the following topic areas:
- Scenario definitions
- Change in energy costs
- Reduction in greenhouse gas emissions
- Reduction in natural gas use
- Increase in electricity use
- Role of temperature-dependent heat pump performance
- Role of rate structures
- Break-even heat pump efficiencies and operating temperatures
- Final thoughts
Scenario definitions
Before diving into results, we should clarify some of the major assumptions and scenario definitions used in the analysis.
Heat pump efficiency scenarios
We looked at three different air-source heat pump efficiency scenarios having nominal efficiency ratings for heating and cooling as follows:
- Cold-climate: 10.5 HSPF, 19 SEER
- High efficiency: 9.5 HSPF, 17 SEER
- Standard: 8.8 HSPF, 15 SEER
Each has a unique heating performance curve as a function of outdoor temperature derived from manufacturer specification sheets for heat pumps with similar characteristics.
We also evaluated a heat pump water heater with a 3.8 UEF efficiency rating.
Furnace scenarios
We evaluated three furnace scenarios:
- Retire an existing 80 AFUE gas furnace and rely solely on the heat pump system
- Use an existing 80 AFUE gas furnace as a backup heating source
- Upgrade an existing 80 AFUE gas furnace to a 95 AFUE gas furnace and use that as a backup heating source
Switchover temperatures
In our models of hybrid heat pump systems with backup furnaces, we define a specific outdoor temperature as the threshold where the heat pump ceases operation, and the furnace takes over. This switchover temperature aligns with the minimum operating temperatures stipulated by utility-sponsored rebate programs, ensuring that heat pumps can function effectively at these temperatures.
The switchover temperatures are:
- 5°F: cold-climate heat pump
- 35°F: high efficiency and standard heat pumps
Other assumptions
Unless indicated otherwise, our default assumptions for the analysis are as follows:
- Electric rate schedule: Fort Collins’ standard rate schedule with time-of-day and tiered pricing (described later in the blog).
- Building square footage: 2,100 square feet.
- Air conditioning: the baseline, pre-heat-pump air conditioner has a 13 SEER efficiency rating. All heat pump scenarios use the heat pump for summer cooling.
- Hot water heating: the baseline, pre-heat-pump water heater is a natural gas storage water heater with a 0.63 UEF efficiency rating. All heat pump scenarios use a heat pump water heater as a replacement for the gas water heater.
Change in energy costs
Using a heat pump without a backup furnace can raise annual energy expenses by $310 to $488, varying with the type of heat pump. In this scenario, the heat pump might be installed as a furnace replacement or an air conditioner replacement. If the latter, the heat pump often needs a greater capacity (i.e. tonnage) to handle heating demands. This can result in increased equipment costs compared with replacing an air conditioner of the same size.
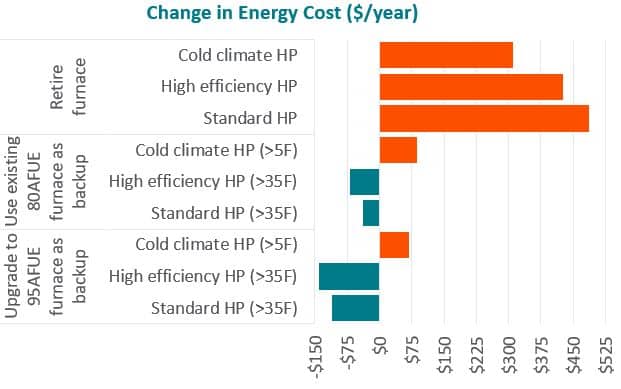
Using a heat pump as a replacement for an air conditioner, while keeping an existing 80 AFUE furnace for backup, is likely to have the lowest upfront installation cost. This approach allows for a smaller heat pump, which is more affordable, and the cost difference between a heat pump and a comparable air conditioner is usually small. With this setup, using a cold-climate heat pump when temperatures are above 5°F results in a slight annual energy cost increase of about $88. However, using non-cold-climate heat pumps, operating at temperatures above 35°F, can save between $39 to $69 on annual energy bills.
Replacing an existing 80 AFUE furnace with a high-efficiency 95 AFUE model further decreases energy costs. However, this option involves higher upfront installation expenses, as it includes both the furnace upgrade and the heat pump addition. This approach can be beneficial for homeowners already intending to buy new heating and cooling systems. When combining a cold-climate heat pump with a 95 AFUE furnace, there’s still an annual energy cost increase of $68.
Greenhouse gas savings
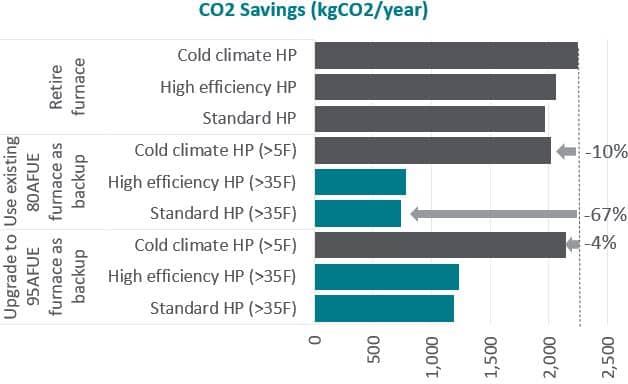
Switching entirely to a cold-climate heat pump for both heating and cooling results in the most significant reduction of CO2 emissions. If you keep the 80 AFUE furnace as a backup, the CO2 reduction is marginally lower, about 10% less than fully retiring the furnace. The most budget-friendly option, which involves replacing an air conditioner with a standard heat pump while keeping the 80 AFUE furnace, achieves roughly 67% less CO2 reduction compared to the most effective CO2-saving method. In conclusion, the strategies that lower energy costs tend to compromise on CO2 savings.
Natural gas savings
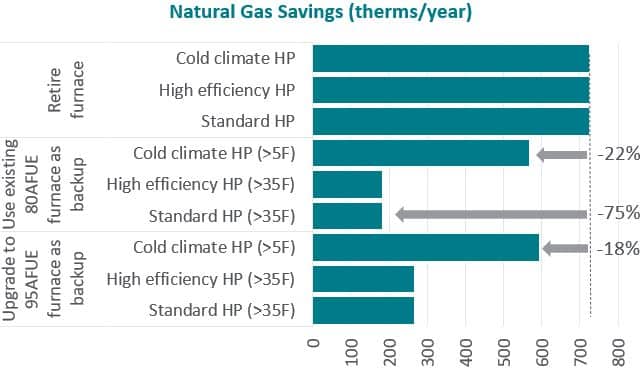
Retiring the furnace leads to an annual saving of 723 therms of natural gas. If the 80 AFUE furnace is used as backup with a cold-climate heat pump, the furnace covers 22% of heating needs. However, when paired with a non-cold-climate heat pump, the furnace’s contribution to heating increases significantly to 75%. This tells us that approximately 53% of heating needs occur in temperatures between the 5°F threshold of cold-climate pumps and the 35°F switchover temperature for non-cold-climate heat pumps. Upgrading to a 95 AFUE furnace increases natural gas savings, particularly when used with regular heat pumps compared to cold-climate ones.
Increase in electricity use
Eliminating the furnace and using only a heat pump system leads to an annual increase in electricity consumption of 7,938 to 9,358 kWh (an 89% to 105% rise compared to baseline electricity use before installing a heat pump), depending on the heat pump type. When using either efficiency level of the backup furnace, non-cold-climate heat pumps raise electricity usage by 877 to 1,092 kWh/year, a moderate increase of 10% to 12% over the baseline. In contrast, cold-climate heat pumps, when backed up by a furnace, result in a non-trivial 4,962 kWh/year (56%) increase in electricity usage compared to the baseline.
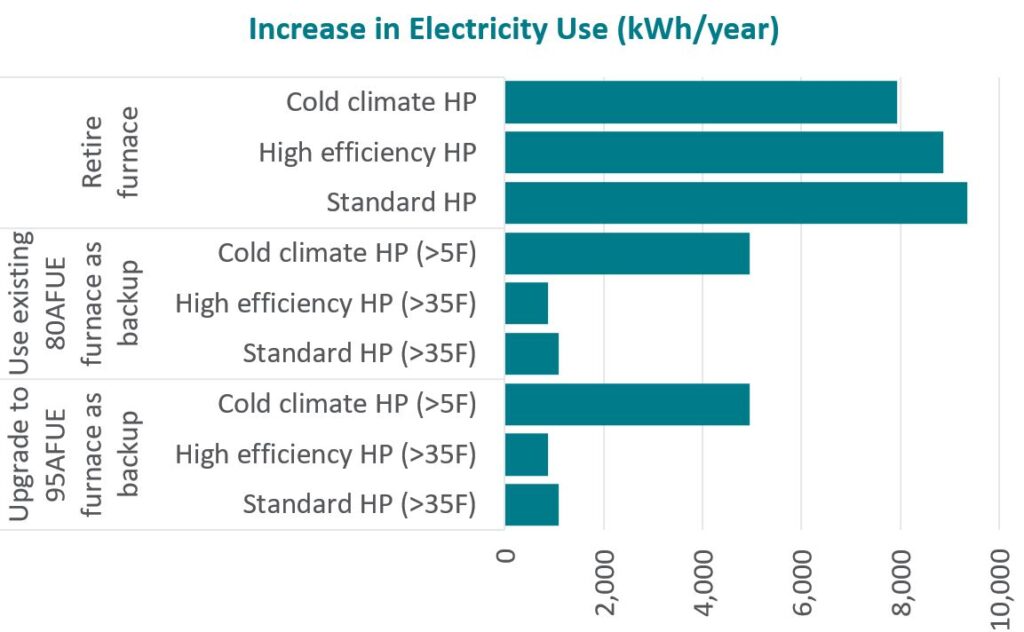
From an electric utility’s viewpoint, hybrid systems reduce grid strain by lessening the need for substantial additional electricity during extremely cold temperatures. This approach leads to lower investments in grid and generation capacity, ultimately benefiting ratepayers by keeping costs down.
Role of temperature-dependent heat pump performance
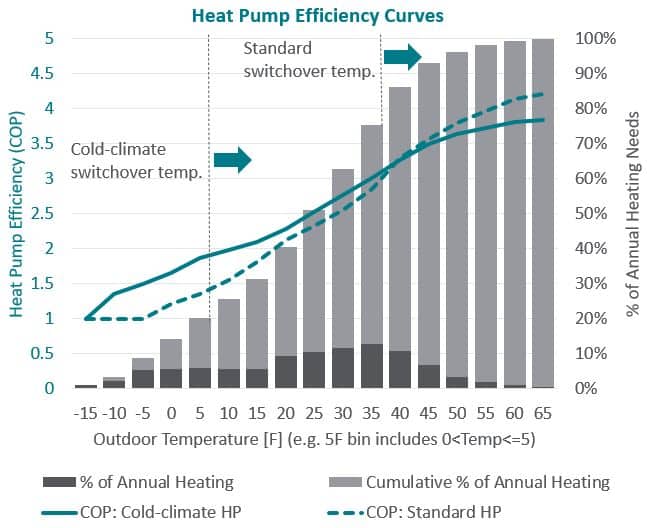
Analyzing the standard heat pump paired with an 80 AFUE backup furnace, we observe a significant outcome. Compared to a cold-climate heat pump without a furnace backup, this setup results in 33% of the CO2 emissions reduction and only 25% of the natural gas savings, as shown in Figures 3 and 4 respectively. This suggests that our standard heat pump scenario delivers heat with a lower CO2 intensity than cold-climate heat pumps operating alone.
To understand why, it’s helpful to examine typical heating performance curves of both types of heat pumps. The solid teal line represents a cold-climate heat pump, while the dashed teal line indicates a standard heat pump. Without a backup furnace, a cold-climate heat pump operates across all outdoor temperatures with Coefficient of Performance (COP) efficiencies ranging from 1.0 to 3.8, meaning it can produce up to 3.8 kWh of heat for every 1 kWh of electricity. On the other hand, the standard heat pump with a backup furnace, having a higher switchover temperature of 35°F, operates with efficiencies between 2.9 and 4.2. Therefore, the standard heat pump, when combined with a backup furnace and set to a 35°F switchover temperature, functions within a more efficient range of its performance curve compared to a cold-climate heat pump without backup.
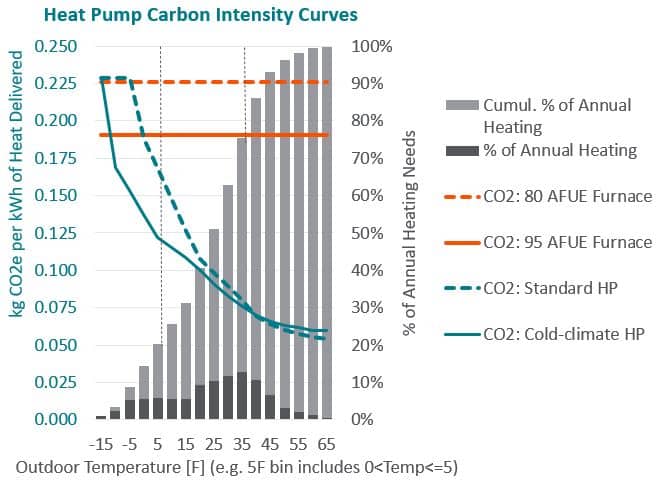
We transformed the heating efficiency curves into carbon intensity curves by incorporating the carbon intensity of electricity. This analysis uses forecasts for electric carbon intensity from the utility, starting at 0.55 kgCO2/kWh and decreasing to 0.11 kgCO2/kWh over seven years, indicative of a shift towards cleaner electricity generation. The average forecasted electric carbon intensity, approximately 0.23 kgCO2/kWh over the 15-year expected lifespan of the heat pump, is used in the charts.
The teal lines represent the carbon intensity of heat delivery from the heat pumps, while the red lines indicate the carbon intensity from 80 AFUE and 95 AFUE furnaces. Operating the standard heat pump below -5°F results in higher CO2 emissions than using an 80 AFUE furnace, and the same applies to the cold-climate heat pump below -15°F. However, these “carbon-neutral” temperature thresholds are likely to be higher in reality since the average hourly carbon intensity of electricity at colder temperatures tends to exceed the annual average.
Role of rate structures
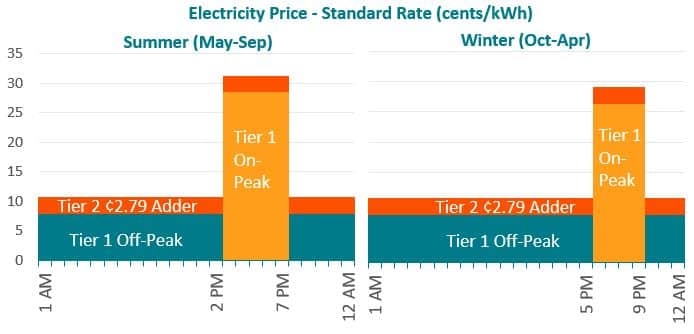
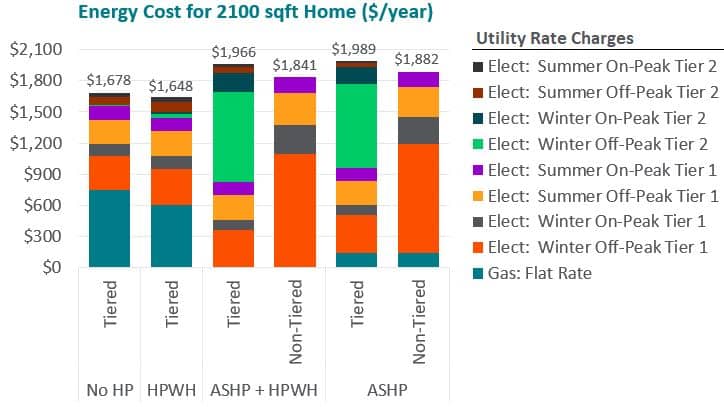
Fort Collins offers a standard electric rate with on- and off-peak pricing, including consumption-based tiers. This means homeowners face an additional charge of 2.79 cents/kWh when their monthly usage exceeds 700 kWh. Installing a heat pump is likely to increase electricity usage, possibly moving homeowners to the higher-priced Tier 2. Therefore, tiered pricing can often disincentivize electrification.
Additionally, the city offers a non-tiered rate, which is 0.77 cents/kWh more than the standard rate’s Tier 1 pricing. This rate is exclusive to customers with all-electric heating systems, likely implemented by the city to encourage electrification by offering a more favorable pricing structure.
We explored various scenarios involving rate structures and heat pump systems to determine how these structures influence overall energy costs. The figure below compares energy costs, itemized by rate charges, for a 2,100 square-foot home using different heat pump setups and either tiered or non-tiered rate structures. The comparison includes homes that upgrade to heat pump water heaters (HPWH), cold-climate air-source heat pumps (ASHP) for heating/cooling without furnace backup, and those implementing both upgrades. For scenarios where homeowners are eligible to switch to non-tiered rates – specifically those upgrading to heat pumps for space heating – energy costs show a decrease by opting for the non-tiered rate structure.
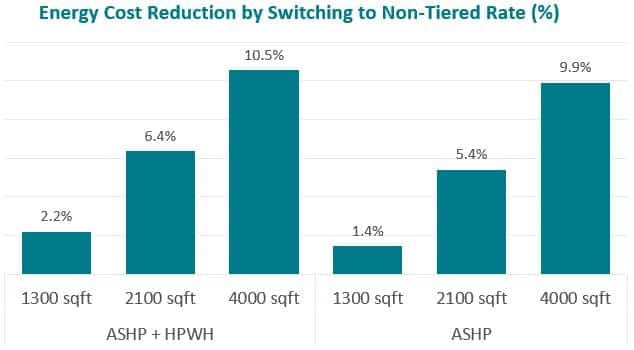
We also looked at how switching to non-tiered rates would reduce energy costs in relation to building square footage. We found that larger homes consuming more electricity would see greater percentage reductions in their annual energy expenses. The key insight here is that while non-tiered rates facilitate electrification, they tend to be regressive, offering more significant benefits to larger and typically wealthier homes.
Break-even COP and operating temperature
Considering the ratios of electricity to gas prices and the efficiency of gas furnaces, we calculated the break-even COPs for heat pumps. These break-even COPs represent the minimum operational efficiency a heat pump must achieve to ensure cost savings at each electric price level.
Our analysis reveals that on-peak pricing requires break-even heat pump efficiencies (COPs ranging from 7.4 to 8.2) beyond what current technology can achieve, making heat pump operation during peak pricing more expensive than using an 80 AFUE furnace. On the other hand, off-peak pricing yields achievable break-even COPs between 2.2 and 3.0. It’s noteworthy that moving from Tier 1 to Tier 2 in off-peak pricing necessitates a significant increase in COP, from 2.2 to 3.0. This indicates that tiered pricing hinders electrification by demanding higher efficiencies to offset the price differences between electricity and gas.
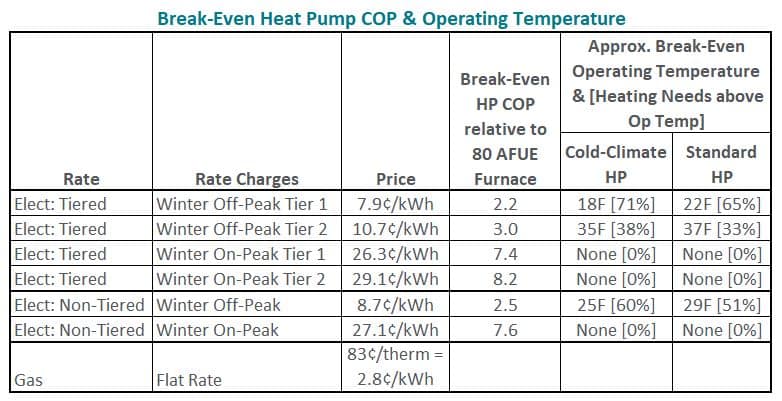
To further interpret this data, we can calculate the outdoor temperature above which a heat pump becomes more cost effective than an 80 AFUE furnace. This break-even temperature was identified using our generalized heating performance curves (as shown in Fig. 6) for both cold-climate and standard heat pumps. Additionally, we calculated the proportion of annual heating needs met by the heat pump at this break-even temperature. For instance, with an electric price of 8.7 cents/kWh (the non-tiered, off-peak rate) and a gas rate of 83 cents/therm, a cold-climate heat pump operates more economically above 25°F. This means it can cost-effectively fulfill 60% of the annual heating requirements (provided all hours were priced at these rates).
Final thoughts
Our detailed analysis of heat pump systems and rate structures reveals key insights for homeowners considering electrification in this Colorado region and similar regions. Hybrid systems, combining heat pumps with backup furnaces, have lower energy costs than using heat pumps alone. However, these lower energy costs require a sacrifice in obtainable greenhouse gas reductions. In terms of utility rates, non-tiered rates encourage electrification, although they favor larger and likely more affluent homes. On- and off-peak pricing greatly influences the cost effectiveness of heat pumps, with current technology unable to meet the high efficiencies required during peak pricing periods. Lastly, the operational cost of heat pumps compared to gas furnaces is highly dependent on outdoor temperatures and the relative price of electricity and gas.


