Decision tree analysis in healthcare can be applied when choices or outcomes of treatment are uncertain, and when such choices and outcomes are significant (wellness, sickness, or death). The idea of assigning values to states of health might seem strange: a score of 1 for perfect health, 0 for death, and somewhere in between for sickness sounds like an Orwellian reduction of someone’s physical or mental health to a number. Yet this approach allows physicians to better identify the most favorable option for patients. With the range of modeling techniques available in Analytica, it can also yield valuable information the robustness of such models and how risk to patients might be reduced.
Decision tree analysis and ‘life years’ outcomes
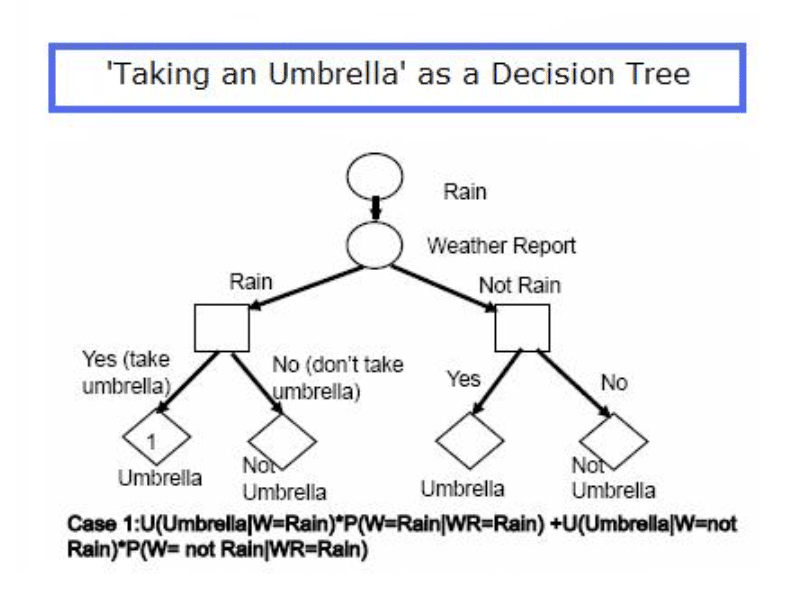
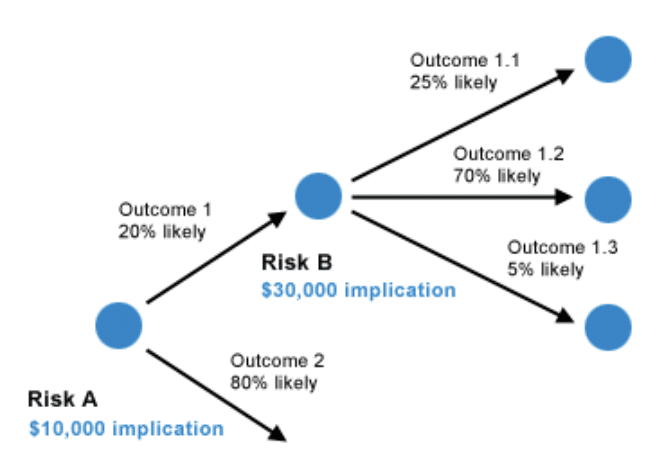
Analytica already gives you the tools to construct decision trees, both graphically and logically. It also gives you the possibility to go much further, as we’ll see below. But first, a quick reminder on how decision trees work. A simple version is to start with a decision node with two or more possible choices. Each choice leads to two or more possible outcomes, and each of these outcomes has a value (the ‘utility’) and a probability of occurring. In decision tree analysis in healthcare, utility is often expressed in expected additional ‘life years’ or ‘quality-adjusted life years’ for the patient. For a given choice, the outcomes are mutually exclusive and exhaustive: in other words, only one outcome can happen, but also, one of the given outcomes must happen.
Optimizing utilities for patients
Once the decision tree has been mapped out with its corresponding outcomes, values (utilities) and probabilities, the best healthcare choice needs to be identified. This is done by first averaging out the outcomes (the sum of the utility x probability for each outcome in a group of outcomes). Then these results are ‘folded’ back towards to the starting point to find the overall highest utility, and therefore the best choice and best path to follow. Besides decision tree analysis in healthcare, other utility models include the Time Trade-Off and the Standard Gamble. These are two different ways of assessing how a patient feels about his or her current state of health, compared to the hypothetical possibility of wellness, but with lower life expectancy; or a remedy with defined chances, but not certainties, of success or failure.
Sensitivity analysis and Monte Carlo simulations
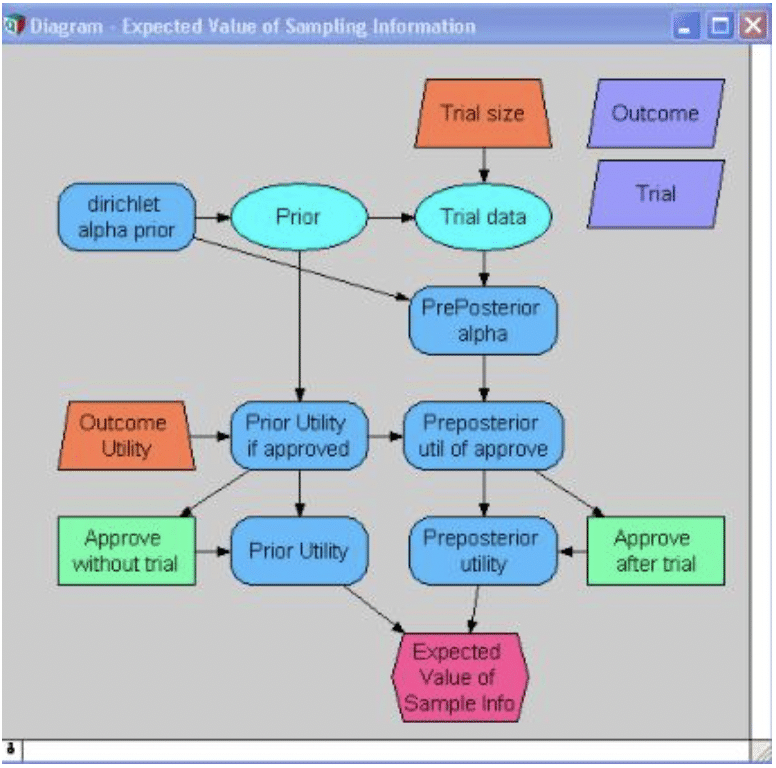
Decision tree analysis in healthcare benefits from sensitivity analysis. This analysis is done by systematically varying values of important parameters through a credible range. If the final outcome does not vary much even as these input values are changed, the solution (treatment for the patient in this case) is considered to be relatively ‘robust’. Analytica makes it straightforward to introduce different ranges and structures of uncertainty into the decision tree model. Each parameter can be given its own probability distribution. As decisions and choices grow more intricate, Analytica then lets users apply Monte Carlo simulation to automatically generate results in terms of not only the best solution, but also the sensitivity of the tree to changes in specific factors.
If you’d like to know how Analytica, the modeling software from Lumina, can help you to analyze and manage decisions of any kind, then try the free edition of Analytica to see what it can do for you.