Like biological species, the graphics used in decision support have a story to tell of origins, evolution and even a few missing links. Influence diagrams represent one of the more evolved forms of these graphics. Clear and simple to understand, influence diagrams in Analytica also contain information that is readily available to users. A big advantage is the way in which they show relationships between factors, as well as distinguishing between controllable or independent variables. But what about their cousins, such as decision trees, Bayesian networks and Markov Chains?
 Image source: Lumina.com
 Image source: people.brunel.ac.uk
 Image source: commons.wikimedia.org
 Image source: Flickr.com
Flow charts
Image source: Flickr.com
Flow charts
 Image source: commons.wikimedia.org
These are also in a sense ancestors of influence diagrams. They show how different paths can be followed to arrive at one or other end results. The beginning and end points may be oval, a process is shown by a rectangle, a decision by a diamond and an input/output process by a parallelogram. Like influence diagrams, a flow chart is also used as a rapid way to get people up to speed on a problem and to give them a common frame of reference.
Image source: commons.wikimedia.org
These are also in a sense ancestors of influence diagrams. They show how different paths can be followed to arrive at one or other end results. The beginning and end points may be oval, a process is shown by a rectangle, a decision by a diamond and an input/output process by a parallelogram. Like influence diagrams, a flow chart is also used as a rapid way to get people up to speed on a problem and to give them a common frame of reference.
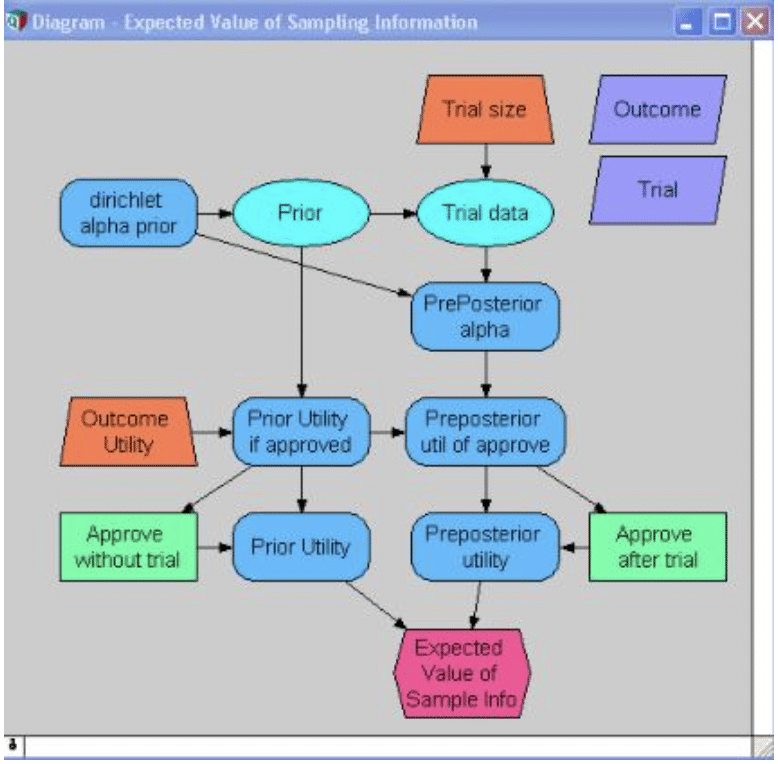 Image source: Lumina.com
Influence diagrams – a quick review
The influence diagram first arrived in the mid-1970s, as a new graphical and mathematical representation of situations requiring decisions. In general, it uses four kinds of node (represented by different shapes and colors) to represent the decision to be made, input values, and probabilistic and deterministic inputs. Influence diagrams in Analytica go further, with nodes defined for decisions, variables, chance, objective, modules, indexes, constants and functions. A probability distribution is defined for each chance node, and a mathematical formula for each of the other nodes. Arrows between the nodes then indicate how each one affects or influences the others. Image source: people.brunel.ac.uk
Decision trees
Influence diagrams and decision trees have similar origins but evolved in different ways. Decision trees consist of an initial starting point, branches to different possible states, and then branches from each of those states to further states, and so on until the different possibilities of interest have been exhausted. At each stage, probabilities define how likely branching to one state is compared to another. Decision trees can rapidly become over-complicated, as ramifications of the tree increase and each additional option then spawns new ramifications. Image source: commons.wikimedia.org
Bayesian networks
An ancestor of the influence diagram, the main function of the Bayesian network is to handle probabilistic inference. On the other hand it lacks the power of the influence diagram to model and solve problems requiring a decision. Also known as a ‘belief network’ it uses only one type of node and associates each node with a probability function. However, the Bayesian network is still useful for modeling simpler situations. Image source: Flickr.com
Flow charts
Image source: Flickr.com
Flow charts
 Image source: commons.wikimedia.org
These are also in a sense ancestors of influence diagrams. They show how different paths can be followed to arrive at one or other end results. The beginning and end points may be oval, a process is shown by a rectangle, a decision by a diamond and an input/output process by a parallelogram. Like influence diagrams, a flow chart is also used as a rapid way to get people up to speed on a problem and to give them a common frame of reference.
Image source: commons.wikimedia.org
These are also in a sense ancestors of influence diagrams. They show how different paths can be followed to arrive at one or other end results. The beginning and end points may be oval, a process is shown by a rectangle, a decision by a diamond and an input/output process by a parallelogram. Like influence diagrams, a flow chart is also used as a rapid way to get people up to speed on a problem and to give them a common frame of reference.