If you are like most practitioners of analytics, you went into the field because you are good with numbers, and you want to help people improve the quality of decisions on important issues. But many of us spend too much time struggling to organize poorly structured data and debugging complex spreadsheets or code and too little time engaging directly with our clients to help them clarify their objectives and decisions, brainstorm better decision options, and explore, visualize and understand the results. Without this kind of interaction, the analysis may fail to address the issues they really care about. Even if it does, clients may not develop the confidence to rely on the insights, and you end up frustrated that your hard work fails to be properly appreciated.
If so, you are not alone. Despite the great excitement about big data, better analytics tools and the vast resources that many organizations are investing in growing their teams and technology, multiple surveys of data analytics groups report that most analytics projects fail to provide real business value. In 2015, Gartner Research estimated that 60% of big data projects would fail over the next two years. In 2017, Gartner analyst Nick Heudecker admitted that they had been “too conservative”: The actual failure rate based on interviews with analysts in large organizations was closer to 85%.
A four-year study of major analytics initiatives in large companies reported in the Harvard Business Review that less than half of the 36 companies studied reported measurable results. Only a third had met their objectives of widespread adoption. A 2019 survey by New Vantage Partners found it “particularly striking that 77% of respondents say that ‘business adoption’ of big data and AI initiatives continues to represent a challenge.” Andrew White, a key Gartner analyst, predicts that it will not get better any time soon: “Through 2022, only 20% of analytic insights will deliver business outcomes”. The excitement (the “hype cycle”) appears to be peaking and about to enter the trough of disillusion.
Why Do So Many Projects Fail?
According to the Gartner survey, key reasons for project failures were “management resistance and internal politics.” The HBR study reported similar findings: The biggest impediments to successful adoption were “insufficient organizational alignment, lack of middle management adoption and understanding and business resistance.” In other words, many survey respondents (practitioners and leaders of data science and analytics groups in large organizations) seemed to blame their managers for failing to recognize the value of their services. These managers were, presumably, often the same executives who had approved large investments in high-priced analysts and technology.
As a long-time practitioner of analytics, I too have found myself on occasion irritated at the obtuseness of my clients and their dysfunctional organizations. But then I remember: Our purpose as analysts is to bring greater clarity and insight to our clients and improve the quality of their decisions. How effective is it to blame them for failing to appreciate the results of our hard work? It is our failure if our clients do not find our services valuable.
Let us assume that we have mastered the technical skills to clean and analyze the data, and how to apply statistical models, machine learning methods, optimization tools and create compelling visualizations. Is it possible that we are spending too much time trying to understand the data and building models, and too little trying to understand our clients?
Who is Your “Client”?
By client, I mean the person or, more often, group of people you are trying to help make better decisions. It may be your immediate manager, a group of senior executives, your consulting client, or a set of stakeholders and subject matter experts from several organizations, end users of decision-support software, or it may even be you. Here I use “analyst” and “client” in singular form, recognizing that one or both are often a team with multiple participants. The client for a project to analyze how best to decommission California’s offshore oil platforms included a wide range of stakeholders: environmentalists, oil companies, fishermen, government agencies and others with strongly conflicting views, all of whom sought to influence the decisions.
Ultimately, the client should be responsible for making decisions, or at least have significant influence over important decisions. Otherwise, why bother? It is unsatisfying to do analysis, no matter how technically sophisticated, if it is irrelevant to real-world decision-making.
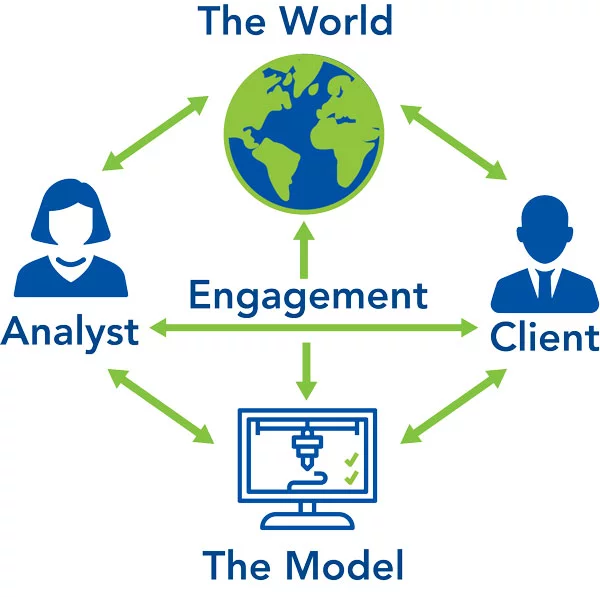
It’s All About the Relationship
Effective analytics is all about relationships. Most obviously there is the relationship between the model you are constructing and a selected part of the world that your client needs to understand. The “model” might be a simple statistical summary and visualization of the data, a sophisticated predictive model, a simulation of a dynamic system, optimization, a decision analysis or decision-support tool. In each case its value depends on having sufficient realism – an effective representation of some relevant aspect of the real world.
At least as important is the human relationship between analyst and client. Too often this relationship consists of just two kinds of interaction: The project starts with the client giving the analyst a brief – sometimes little more than “see what insights you can find in this data.” And it ends with the analyst presenting the client with the “results” – often a Powerpoint presentation and a written report. This approach is a recipe for failure. Success requires a much more extensive engagement to clarify the client’s perspective and objectives and develop the insights.
Geeks and Empaths
For most practitioners of analytics, our aptitude and training is about numbers, equations and software – the hard skills. Not to put too fine a point on it, many of us identify as “geeks.” Few of us start out with substantial soft skills, the emotional intelligence to effectively engage with our clients – how to ask probing questions in a nonthreatening way, listen effectively, observe tacit body language, get inside the heads of our clients and learn how their organizations work. In short, we need to become “empaths.”
Fortunately for us geeks, it is possible to learn these soft skills once we realize how critical they are to our success and decide to put the effort. We can learn some of them from classes. They should become a much larger part of the analytics curriculum. But, to become truly effective, there is no substitute for working with clients on real projects being mentored by experienced practitioners.
There are a variety of methods and tools designed to support and encourage effective engagement. Many were developed by decision analysts, the subfield of analytics that has perhaps paid most attention to the relationship between analyst and client. The rest of this article introduces the most useful of these tools and methods.
Asking Effective Questions
Asking effective questions is not as obvious as it may appear. There is an art to wording questions that are effective not just in getting answers to what you initially think the project is about, but rather to foster a deeper collaboration to clarify what would be most useful for the client. Open-ended questions are often productive in early stages. It is especially important to ask about the client’s objectives, what decisions the client can control or influence to improve the chance of achieving those objectives. A client’s decisions and objectives may at first appear confused or even contradictory. The analyst must do a lot more than simply ask the client direct questions. Rather, analyst and client must collaborate closely to clarify the client’s perspective and structure it into an operational form amenable to analysis. Then you can ask how possible insights from analyzing available data might improve those decisions. Often this will reveal a gap between what the data could possibly provide and what information is needed for improving decisions – a gap that may be filled by a decision model that uses expert judgment to supplement results from the data.
Influence Diagrams
Decision analysis is perhaps best known for its use of decision trees, which are very useful for structuring simple decisions under uncertainty. But decision trees become less tractable for complex problems because the number of branches is exponential in the number of decisions and uncertainties. Influence diagrams are a complementary visual representation that is far more practical for structuring complex problems and deserves to be much more widely known. Decision analysts developed influence diagrams as a graphic facilitation tool for helping clients clarify their perspectives, objectives and decisions, as well as uncertainties, and so structure complex decision problems. Even people with limited quantitative skills find them quite intuitive.
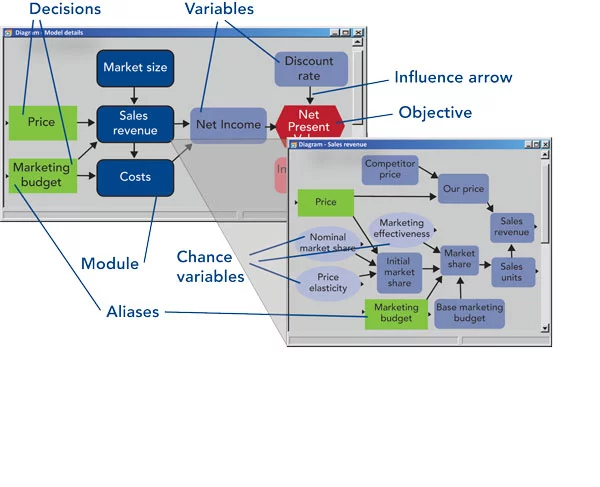
In Figure 2, each node depicts a variable, with its role indicated by shape and color:
- A decision (green rectangle) is under the direct control of the decision-maker, such as price or marketing budget for a company that sells products or services.
- A chance variable (light blue oval) has an uncertain outcome that the decision-maker cannot control and may be expressed as a range of possible values. Decision analysts typically represent uncertainty as a probability distribution.
- An objective (red hexagon) expresses a quantity that the decision-maker desires to maximize or minimize, such as expected net present value. Decision analysts like to define this as utility, often comprising a risk attitude and multiple attributes – sub-objectives.
- A deterministic variable (blue oblong) depicts an input or calculated variable that is a deterministic function of the variables that influence it.
- A module (dark blue oblong with thick border) depicts a sub-model with its own diagram, providing a way to organize a large model as a hierarchy of comprehensible elements.
Typically, the analyst starts by interviewing the client asking about key objectives, decisions and uncertainties, drawing each element as a node on the diagram. You may also ask about key sources of relevant data, uncertainties and relationships to help predict how decisions will affect the outcomes and objectives. You draw in influence arrows to show how the variables affect each other.
As the analyst and client team collaborate in drawing influence diagrams, they must identify the role of each variable: Is it a decision, a chance variable, objective or something else? This process naturally focuses attention on key issues. The effort to distinguish decisions and chance variables often leads to a fruitful discussion about decision-makers’ scope of control and influence. Asking about a client’s objectives can lead to a deeper conversation about the organization’s aims and attitude to risk.
When possible, it helps to work face-to-face with clients so that you can be alert to tacit nonverbal communication and body language for closer communication. But influence diagrams are also helpful to facilitate the conversation when clients and analysts must meet via web meetings. In either case, the goal is for analyst and client to develop a deep shared understanding of the decision problem.
Initially, an influence diagram is a purely qualitative depiction of variables and the influences among them. Formally, they extend Bayesian belief network representation, which has only chance nodes by the addition of decisions, objectives and other roles. Usually, the analyst subsequently works separately from the client to quantify the model by adding a mathematical relationship to quantify each influence. Values and influences may be deterministic or probabilistic. Deterministic influences may be simple accounting relationships (Earnings = Revenues – Costs). Probabilistic influences may be based on empirical models estimated from data, or judgments of conditional probabilities estimated by clients or subject matter experts.
During model development, analysts often add further variables to extend the model and influences. It is helpful to move these additional variables into a module or sub-diagram to avoid making the original diagram too complex. In this way, you can organize a complex model with hundreds or even thousands of variables as a hierarchy of modules, each with its own diagram and simple enough to be easily comprehensible. But it is helpful to retain those diagrams developed directly with clients in something close to their original form so that clients can later recognize their contributions to the modeling process.
Agile Analytics
Software developers borrowed the traditional waterfall process from the engineering and construction industry. It prescribes a sequence of steps: Needs analysis, specification, design, implementation, quality assurance, documentation, user testing and deployment. But too often with software, clients and prospective users find it hard to articulate all their needs before they see concrete example software and learn what is possible. So nowadays an agile development process is more popular for software; you start with a brief exploration of user needs, often getting responses to simple mockups. You build a simple working proof of concept or prototype. You get feedback from initial trial users. In response, you refine and extend the software. You iterate the process until the users are satisfied – or you run out of time and money.
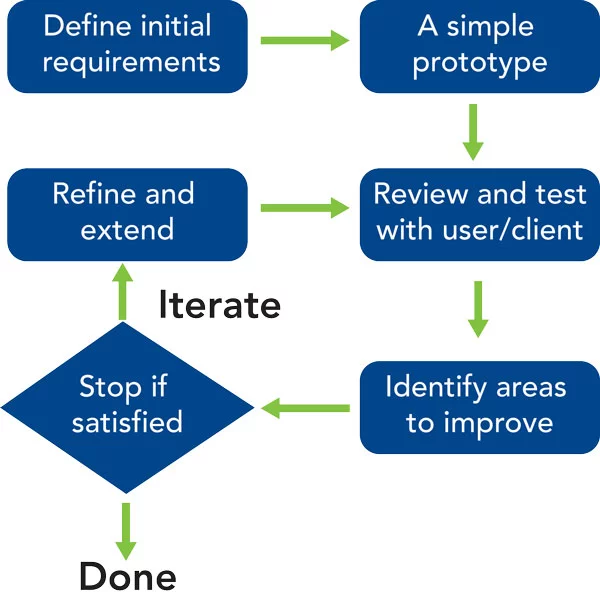
A similar agile approach works best for analytics projects. Even after initial engagement with the client it may not yet be clear what data is available, how best to scope the project and frame the objectives, and what aspects of the problem are most important. You can get valuable feedback from an early working prototype. You can then refine the analysis, focusing on extending those aspects the client sees as likely to be helpful and using sensitivity analysis to guide priorities.
This iterative process requires a series of engagements during which you may help clients refine their decision and objectives as you refine and extend the analysis. It produces a more rapid convergence between the evolving understanding of client’s needs and the model designed to address them, which is much more likely to provide real value than single cycle development.
It also means that clients are likely to get useful insights early in the process, rather than having to wait until a “final presentation.” Given the inevitable uncertainties about client needs and the level of effort to conduct the analysis, it greatly reduces the risk of running out of time or funds before the client gets useful insights and recommendations. Interim results will often inspire the client to identify new questions, decisions or objectives, and propose project extensions to obtain additional value from the process.
Uncertainty and Sensitivity Analysis
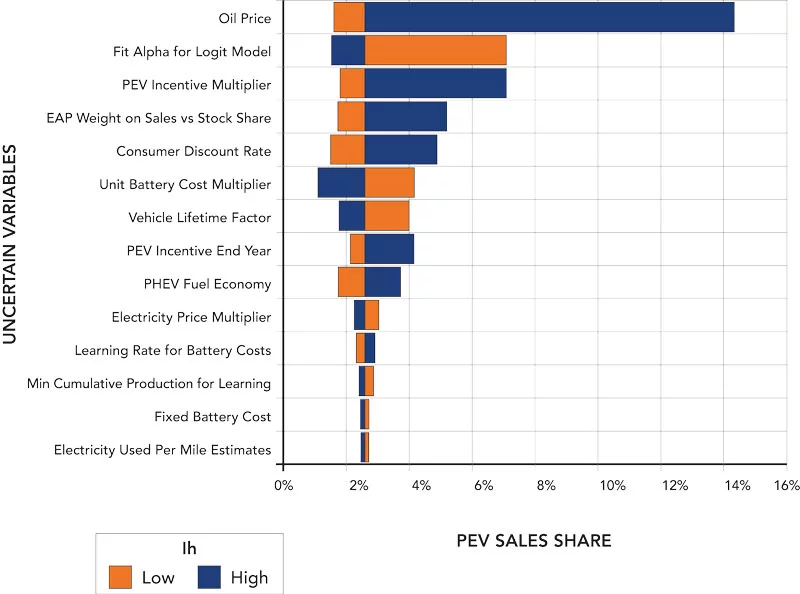
No matter how much data we have, it has a big limitation: It comes only from the past. The goal of analysis is to predict how our decisions will affect outcomes in the future. We can build predictive models, whether simple time-series forecasts or complex systems dynamics simulations, but we always need human intelligence to extrapolate into the future – even to say that we expect past trends to continue. More often, changes may accelerate, or revert back to a long-term mean. There are inevitable limits to the predictability of natural and economic systems. We should explicitly represent each of these uncertainties in our analysis. It is often easiest to select a range, low, base and high for each quantitative assumption (even the assumption that past trends will continue). Later, where appropriate, we may express some uncertainties as probability distributions.
Sensitivity analysis shows us which uncertainties, whether ranges or probability distributions, could make a significant difference to the objectives and recommended decisions. It is often a potent source of insight. It also gives valuable guidance for the next model refinement so we can focus further data gathering, model fitting and model building on the issues likely to make the most difference. These are often not the ones we expect. In particular, it helps avoid the common trap of spending too much time analyzing the issues for which we have the most data rather than those most relevant to your client’s decisions.
Sometimes you may find a decision strategy that is relatively robust, which performs well in the face of a wide variety of possible futures. If not, you may be able to identify new decision options to create a more robust decision strategy. These kinds of explorations are more effective in collaboration with your client. What if you find results that are unexpected or surprising to you or your client? That is an indicator of the need for deeper investigation. Perhaps there is an undiagnosed problem with the data problems or a bug in the model. Sometimes it turns out that there is something wrong with the mental models that form our expectations. Once you understand the problem, you and your client can improve your mental model, gaining valuable new intuitions.
Interactive Decision Support
To assist in their deliberations on how to decommission California’s offshore oil platforms mentioned above [8], we provided the conflicting stakeholders with an interactive multi-attribute decision model to help them compare the effects of alternative decision options. They could use this to explore the sensitivity of the decisions to the differing weights they put on the objectives: economic cost, legal compliance, environmental impacts on marine life, air quality and so on. This interactive exploration helped them realize that, even though they might have different objectives, they could reach a near consensus on the same “rigs to reefs” option – to leave most of the platform supports in place as an artificial reef that already had a rich marine ecosystem.

We often learn best about how things work by direct experience – by playing it directly – rather than being told about it. Often the most effective way for you and your client to understand a model and get real insights is to interact with it. You can explore the effects of alternative scenarios and changing assumptions to get a visceral sense of what matters and why.
A large model with Monte Carlo simulation to represent uncertainty and complex optimization to find the best strategy may take hours to compute each scenario representing combinations of exogenous variables and decision strategies – which seems to preclude interactive exploration. In such cases, it is often helpful to build a simplified model, a response surface fitted to pre-computed results from the full model for a wide representation of scenarios. This model can then allow fast interactive exploration but feels as if you are using the full model.
Conclusions
The projected continuation of high failure rates of analytics projects is not inevitable. Successful analysts already know that effective client engagement is a key to their success. They understand that effective analytics, like any kind of consulting, relies on building a shared understanding between analyst and client. The first step for less experienced analysts is to recognize that success in providing results that clients truly appreciate depends as much on the quality of this engagement as on hard skills with techniques and tools. The good news is that we can learn these soft skills if we pay attention and practice on real projects with experienced mentors. I have outlined a number of methods and tools that can help in this endeavor:
- Ask questions carefully to develop the kind of conversation that lets you learn how your client thinks, what they care about and what decisions they can affect.
- Use influence diagrams to help your clients clarify these decisions, objectives and uncertainties, and see how data-based models can lead to better decisions.
- Use agile development: Start from a simple proof-of-concept, then iteratively refine, and extend the analysis or model guided by feedback from your client and sensitivity analysis.
- Express risks and uncertainty explicitly in both statistical models and expert estimates.
- Use sensitivity analysis to find out which uncertainties really make a difference to the recommended decisions and why.
- Provide interactive decision models to enable your clients to viscerally experience how the outcomes they care about respond to changing decision strategies, assumptions and tradeoffs between objectives.