Wouldn’t it be great if your financial analysis platform helped you build intuition about the projects you’re considering, not just provide end-of-the-line financial metrics? Well, that’s exactly what you can do with Analytica—without having to manually run or write code for dozens of sensitivity analyses!
Imagine you want to find which assumptions or investment decisions—like technology performance, interest rates, project size, or debt versus equity tradeoffs—have the most impact on financial metrics. That information can tell you which assumptions are worth refining by getting more data, and which levers can help you optimize your financial objectives.
Analytica’s influence diagrams, intelligent arrays, tornado diagrams and Monte Carlo uncertainty analysis transform an otherwise uninsightful financial model into a master class on the underlying factors that drive financial outcomes. Instead of putting managers to sleep during financial presentations, keep them on the edge of their seats with compelling decision-making insights.
Don’t just take my word for it, jump to the bottom of the page to explore an illustrative model.
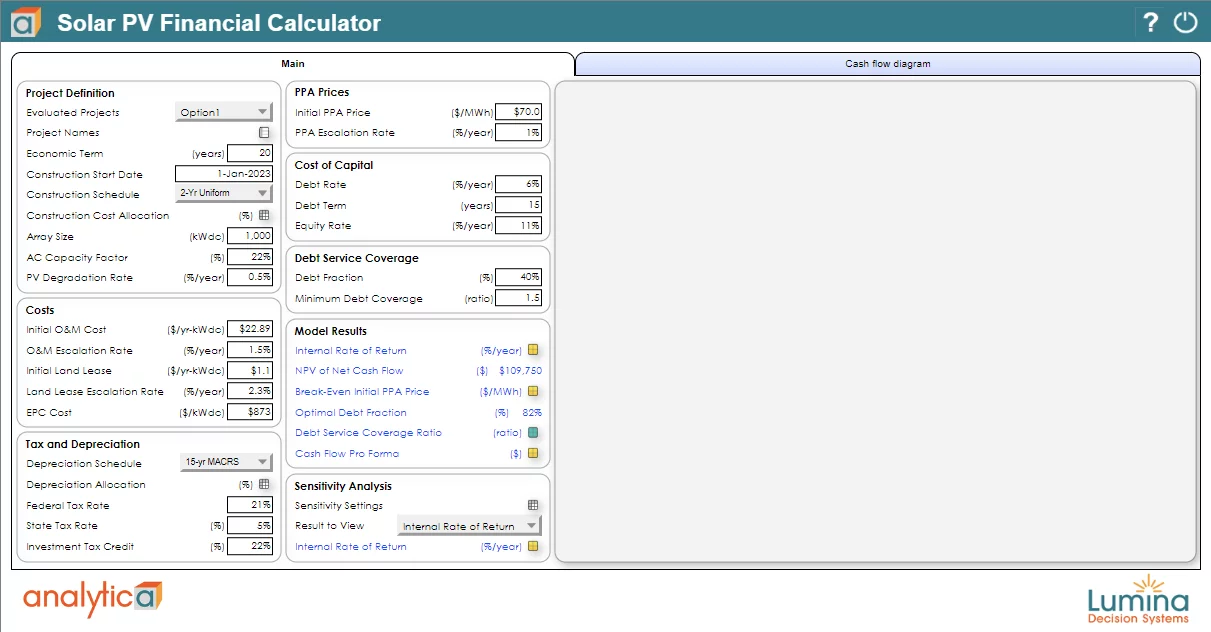
Lumina’s Solar PV Financial Calculator, for example, captures the drivers that impact net present value and internal rate of return (IRR) for solar projects. We can quickly define low and high bounds on each input assumption, and explore how much each assumption affects the results. An insightful way to view those sensitivities is with a tornado diagram.

The tornado diagram highlights that the initial price in a power purchase agreement (PPA) has the largest influence on IRR. The next most influential assumption is the AC capacity factor, which characterizes the energy the project will produce. Input assumptions that appear at the bottom of the tornado are the least influential.
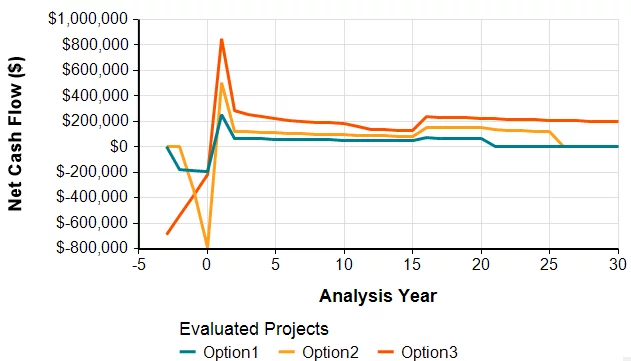
Intelligent Arrays let you flexibly extend model dimensions so you can compare alternative projects, future market conditions, and so on. With Analytica, you no longer have to duplicate spreadsheets, tabs, tables or logic for each scenario. Intelligent Arrays handle all that for you.
Analytica lets you formulate an analysis visually using influence diagrams. They make it easy to show the relational dependencies to your clients, to quality control the logic, and to share your work with others for quick review or modification. Gone are the days of trying to figure out what $Z$86 represents in your spreadsheet equation or staring at endless lines of code in your programming platform.
You don’t have to take our word for it. Try out our Solar PV Financial Calculator below to see for yourself.
Did we mention you can make your Analytica models easily accessible online using Analytica Cloud Platform (ACP)?
Click to start this model. Or run it in its own browser tab.