As COVID-19 testing becomes a routine part of doing business, some operations face the question of whether testing should be mandatory or voluntary. A naval vessel provides a simplified case study since we can focus only on the question of whether a sailor is required to be tested before boarding. Once the ship is as sea, the decision to allow entry to the premises does not reoccur as it might with an office building where people show up for work every morning.
A policy that makes tests readily available and encourages sailors to be tested before setting sail (where those with positive test results would not board the ship) would be an improvement compared to no testing, reducing the number of infected persons that are discovered once at sea. A policy that requires every sailor to be tested before boarding is more intrusive and can introduce problems and inconveniences. For example, cases will inevitably occur in which a healthy sailor wasn’t able to get tested because of a scheduling conflict and is thus unable to board. There will be fewer cases as sea with mandatory testing, compared to voluntary testing, but is the reduction sufficient to justify the downsides?
Rather than debating this policy decision in the abstract, I compare the two policy options quantitatively with a simple model that calculates the differences in infection rates among the sailors that are allowed to board under each of the two policies. I also compute the probability of setting sail with zero infections among the crew.
Input estimates
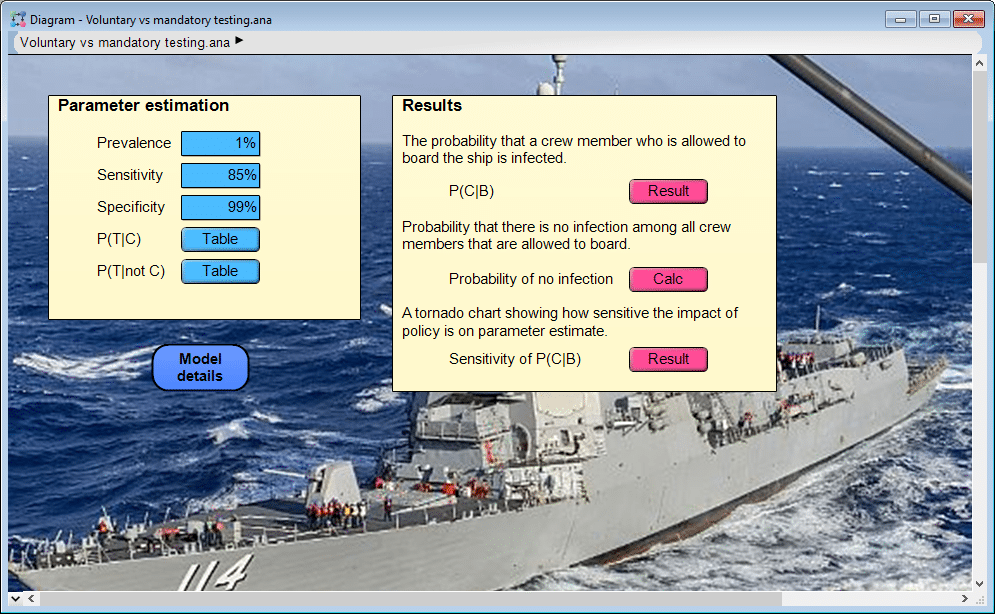
The model shown above requires five input parameter estimates. Here I will also describe these with a probability notation, where each probability applies to an individual, and the following letters are used: C=infected with COVID-19, T=gets tested, N=negative test result, B=boards the ship.
(Point) Prevalence, P(C), is the frequency of active COVID-19 infections among the population of prospective sailors before any testing is done.
The accuracy of the tests are described by two parameters: sensitivity and specificity. Sensitivity is the probability of a positive test result given that a person is infected. Specificity is the probability of a negative test result given that the person is not infected.
The behavior of people under a voluntary policy is captured by two parameters: P(T|C), the probability that a COVID-19 infected individual elects to get tested, and P(T|not C), the probability that a non-infected individual elects to get tested. A simplification would be to set these to be equal, P(T|C)=P(T|not C)=P(T), the probability of getting tested; however, even though people don’t know whether they are infected or not before getting a test, there are reasons to believe infected individuals are more likely to get tested. Someone with curious symptoms, a previous exposure, or who has been in high risk situations may be more motivated to get a test.
In the model, P(T|C) and P(T|not C) vary by policy. In the mandatory testing policy, P(T|C)=P(T|not C)=1, since everyone gets tested. For my example results below, for the voluntary policy I use P(T|C)=60%, P(T|not C)=40%.
Computed results
Under each proposed policy, the model computes the probability that an arbitrarily selected crew member who is allowed to board the ship is infected. This is denoted P(C|B) – the probability of having COVID-19 given that you are allowed to board. As I’ll show below, P(C|B) is obtained from the parameter estimates above by applying simple laws of probability.
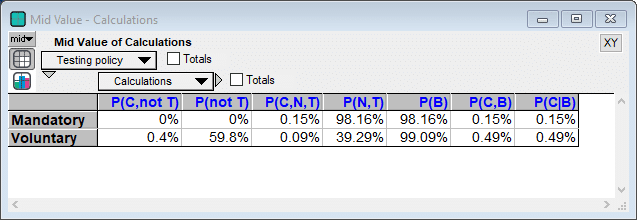
With the parameter estimates shown in the the previous section, the probability that any given crew member boards with COVID-19 is 0.15% when a mandatory testing policy is enforced, and 0.45% when testing is voluntary. In other words, with mandatory testing, 1 in 650 sailors will board with COVID-19, while with voluntary testing the rate will be 1 in 200 sailors on average.
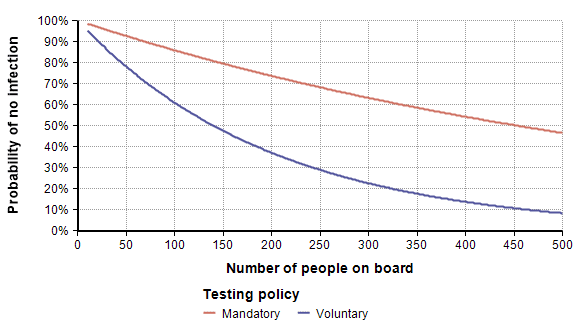
To explore the ramifications at the level of the entire crew, the model also computes the probability that no infected sailors board the ship. Of course, this probability decreases with larger crews. This is depicted as a function of crew size in the following graph.
Sensitivity analysis
The results above show that a voluntary testing policy results in infection rates that are about 3-times higher than with a mandatory testing policy. A sensitivity analysis reveals how sensitive this result is to the prevalence rate and other estimated parameters. The following tornado chart depicts the sensitivity of the increase in infections from a voluntary policy to each input parameter.
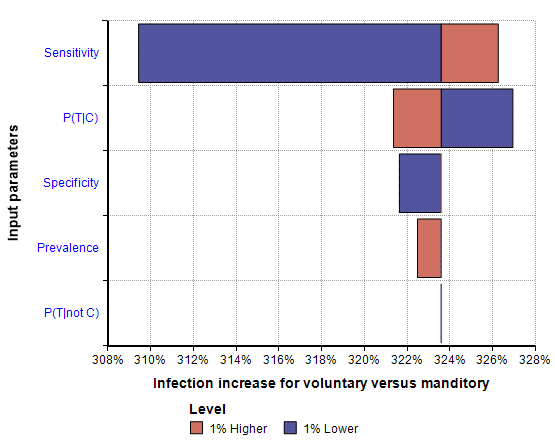
Tornado chart showing how sensitive the increase in infections from a voluntary testing policy is to each of the estimated parameters.
The result that voluntary testing increases infection rates 3-fold compared to mandatory testing is robust to changes in the underlying prevalence rate. However, if you switch to a test that has a lower sensitivity, the effect is less robust.
Using the model
I have provided this model as open source, so that you can explore the impact of your own estimates, or adapt the model to your own organization if you are formulating testing policies in analogous situations. To use it:
- Install Analytica Free 101 if you don’t already have Analytica installed on your computer.
- Download the model file.
- Launch Analytica and open the model file.
Mathematical derivation
The conditional probability, P(C|B), that represents the probability that an individual sailor is infected given that he is allowed to board, is derived from the five input parameters listed earlier from simple laws of probability. The five estimated parameters are denoted:
- P(C): Point prevalence
- P(N|T,C): False negative rate (= 1 – sensitivity)
- P(N|T,not C): True negative rate, known as specificity.
- P(T|C): Probability an infected person takes the test
- P(T|not C): Probability a non-infected person takes the test.
The event B (a sailor is allowed to board) is true when a sailor takes the test and gets a negative result, or when the sailor does not take the test. I.e., B = (T,N) or (not T). This is used in the third line of the derivation.
- P(C|B) = P(C,B) / P(B)
- P(C,B) = P(C,not T) + P(C,N,T)
- P(B) = P(not T) + P(N,T)
- P(N,T) = P(N|T,C) P(T|C) P(C) + P(N|T,not C) P(T|not C) (1-P(C))
- P(C,N,T) = P(N|C,T) P(T|C) P(C)
- P(not T) = (1-P(T|C))P(C) + (1-P(T|not C))(1-P(C))
- P(C,not T) = (1-P(T|C))P(C)
You can compute P(C|B) from the input parameters by evaluating the lines of the derivation in reverse order.
Summary
As the economy opens back up, many organizations need to decide what level of testing is warranted. There are many trade-offs that need to be weighed, so it makes sense to estimate the trade-offs quantitatively. In the example featured here, I found that a voluntary testing policy would result in a 3-fold increase of infections relative to a mandatory policy. The amount of increase exceeded my own intuition prior to carrying out the analysis. If you are dealing with a maritime vessel, or other closed system where people aren’t leaving and returning each day, you may find the model considered here to be useful. In other situations, you may find this to be a good starting point.