A few years ago France beat Croatia in the World Cup final. Congratulations to France for winning the last world championship! And also to Croatia for making it to the final after a spectacular sequence of surprise upsets!
Also yesterday, I overheard a conversation where someone was saying that the outcome of these World Cup games is nearly random, since the typical scores in soccer matches are so low, often won by a single goal. This got me thinking about quantifying this. Perhaps France really was the better team in this case, but even so, if they were to repeat that final game, what’s the probability that Croatia would win given the stochastic aspects of the game? Or, if you believe Croatia should have won, can you support that quantitatively by showing that a 4-2 loss was not that improbable?
To approach these questions, it is useful to learn about the Poisson distribution. Here I used the Poisson distribution to model the number of goals scored by a given team in a match. The core assumption behind this distribution is that the same scoring rate applies to every moment of play — i.e., a given team is equally likely to score in the first minute as in the 94th minute or in any overtime minute, and this is independent of previous goals scored. To estimate the Poisson, you need to estimate the expected (mean) number of goals that will be scored by each team. The estimate is your way of encoding your beliefs about how each team compares to the other after taking into account the overall strength of each team and the interplay of their playing styles. Here I’ve created a model that uses that estimate to compute the probabilities of possible outcomes.
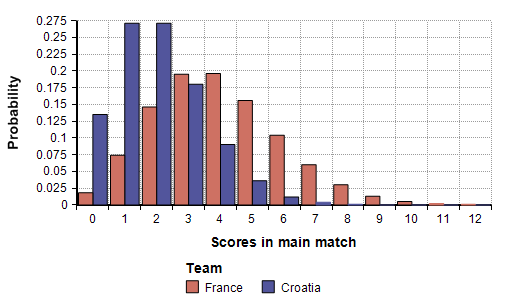
For me personally, the final game is the best information I have about the abilities of France and Croatia against each other. So my best estimate is that during any given 95 minutes of play, France can be expected to score on average 4 goals, and Croatia on average 2 goals. If you have better assessments about these teams to use, you can fire up the model and plug them it. Using these numbers, the number of goals actually scored by each team in a new match during the first 95 minutes of play would follow the distributions shown here.
From these, the model predicts a probability of 73% that France would win again without any overtime, 15% that Croatia would win during the main match, and a 12% chance they would be tied and the game would go into overtime
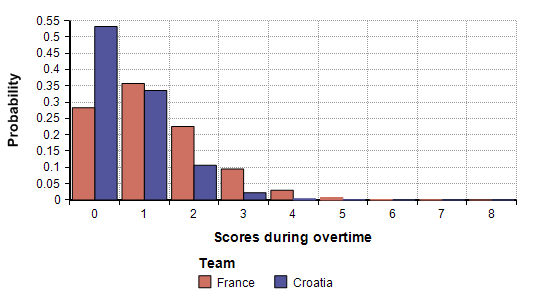
If it goes into overtime, the number of goals scored by France during overtime would follow a Poisson( 4 * 30/95 ) = Poisson(1.26) distribution, since overtime play goes for 30 minutes, so my estimated rate of 4 goals per each 95 minutes of play is scaled to 30 minutes. In other words, during overtime, on average France is expected to make 1.26 goals, and Croatia 0.63 goals. The distribution over the actual number of goals that would be scored during an overtime (if there is an overtime) is shown here
The final score after overtime is obtained by using the score during the main match if not tied, or by adding the scores during overtime to the scores during the main match. The outcome at this point is 79.5% France, 17% Croatia and 3.5% chance that the outcome will be decided with penalty kicks.
Normally I would ascribe a 50/50 chance to each team winning a penalty kick (PK) playoff. The outcome of those final penalty kicks tie-breakers seem (to me at least) to be about as predictable as flipping a coin. However, in this case, I’m actually going to ascribe a slightly higher probability that France would win a PK showdown. This is based on the performance of France and their goalie throughout the series. Nevertheless, my assessment is that if a new match were to enter a PK showdown, France would have a 60% chance of being victorious. Instead of using a Poisson to model PKs, I use a simple 60/40 ChanceDist. Of course, if you want to play with the model, you can enter your own estimates.
With that, the model predicts that in a France-Croatia rematch, there is a 82% chance that France would win again, an 18% chance that Croatia would win. If I had these numbers yesterday when I overheard that conversation about how the outcome is more a matter of random chance than actual skill difference, I might have argued otherwise, at least in this case.
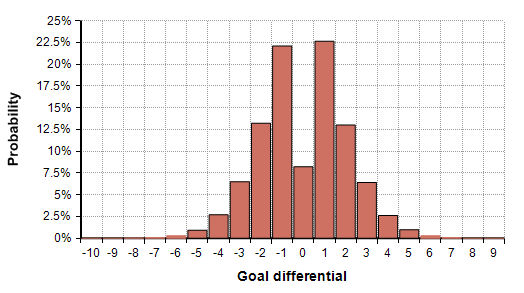
The model can also be used to explore other scenarios. For example, suppose going into the match, you believed that the two teams were equally matched, with each expected to score 2 goals in the first 95 minutes. You can plug these estimates into the model and explore the distribution of possible outcomes. Using that estimate, the distribution on goal differential (with France being positive numbers) is shown here:
Here the chance of France winning by 2 or more goals (as actually happened) given this assumption that the teams were equally matched is 23%.
Play with this model yourself. Explore the distribution of outcomes for other matchups, using your own assessments. To do so, install any Analytica edition, or use the free edition, and then download the model.


