In a meeting today, Paul Sanford suggested that it would be nice if Analytica would show the indexes of a variable when you hover over its node. “I know how I can do that right now,” I volunteered. I thought I’d share this with other Analytica users here. The helpballoon with my modification shows the indexes on the last line.

The indexes come from the computed result, so it only shows them if the result is already computed. If the result has already been computed and is scalar, then it shows the value, allowing you to hover over nodes and see their scalar values (text or numbers) quickly.
To make it easy, I’ve placed this in a library file, Show-Indexes-In-Help-Balloons.ana. If you want this, all you have to do is add this library to your model (use Add Module… or Add Library… on the File menu, embed).
How does it do it?
The code in Analytica that decides what should appear in a help balloon is actually implemented as an Analytica expression, and it resides in the Definition attribute of a system function named CustomizeBalloonHelp. You can view this code in an object window by opening the typescript window (Analytica’s command-line interface) by pressing F12 and typing show object CustomizeBalloonHelp. I started by creating my own user-defined function and coping the Parameters and Definition attributes from CustomizeBalloonHelp. Then I replaced the Definition of CustomizeBalloonHelp with a call to my function. When you look inside the library, you’ll see it contains just this single function. I then enhanced the function to add the value or indexes to the end of the text.
I added some code near the end of the function that looks like this
Var val := If Sample(IsResultComputed(obj)) Then Sample(obj) Else If IsResultComputed(obj) Then obj Else Undefined;
If val<>Undefined And txt<>"" Then txt := txt & Chr(13);
MetaIndex inds := IndexesOf(val);
If Size(inds)>0 Then txt := txt & "Array[" & JoinText( identifier of (inds), inds, ',' ) & "]"
  Else If IsText(val) Then txt := txt & '"' & (If TextLength(val)>30 Then SelectText(val,1,30)&"..." Else val) & '"'
  Else If val <> Undefined Then txt := txt & val;
The first line sees if the value is already computed — either the Mid (deterministic) value, or the Sample (uncertainty/probabilistic) value. The second line adds a newline to the existing balloon text if there is something new to display, so that our value will be on a new line in the balloon. The third line looks up the indexes of the value. Then the If-Then-Else-if-... construct decides how to display it based on what kind of value it is. If it is an array, it shows the indexes. If it is text, it shows the text in quotes, truncated to 30 characters with trailing ellipsis if longer than 30 characters. Or for other values (e.g., numbers), it shows the value (coerced to text automatically).
There is other stuff in the Definition, mostly copied from the already existing logic, which you can view once you add or open the library.
Show with values
 Even without my customization to balloon help, Analytica already does something like this, just not in the help balloon. You can turn on Show With Values from the Object menu, and then it displays the dimensions of variables in the Analytica user interface in various places where variables and identifiers appear. For example, when you look at the Inputs and Outputs in an Object Window or attribute panel, the indexes (or value) shows provided that the variable has already been computed. Notice the value or indexes shown to the right of each input in the Object Window shown below. Also the titles of the indexes for the variable itself appear in the Value attribute.
Value in attribute pane
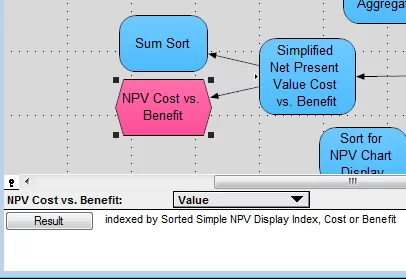
Another “trick” for browsing the computed values or dimensionality of your variables is to select the Value attribute in the attribute pane below the diagram (or if you want to see the probabilistic/uncertain Sample value, select ProbValue). You can then click on each variable in the diagram and its computed value appears in the attribute pane, when the value is scalar, or its list of indexes appear there when it is an array. The pane provides a Result button that lets you view the result table with one click for array results.
In some models this is a very fast and convenient way to view the values and dimensionality of many variables quickly; however, I often find many things annoying when I have the attribute pane set to Value or ProbValue. Clicking on a variable can cause it to compute, which causes error messages to display if there are errors in your definitions, and can take time for complex computations. If you encounter these problems, then just select a different attribute in the attribute pane.
Have fun!
Once again, if you like the Balloon Help enhancement, just download my library file, Show-Indexes-In-Help-Balloons.ana, and then use Add Module… to add this to your model.