Skip to content
Analytica > Blogs > How to draw an influence diagram in 3 minutes

How to draw an influence diagram in 3 minutes

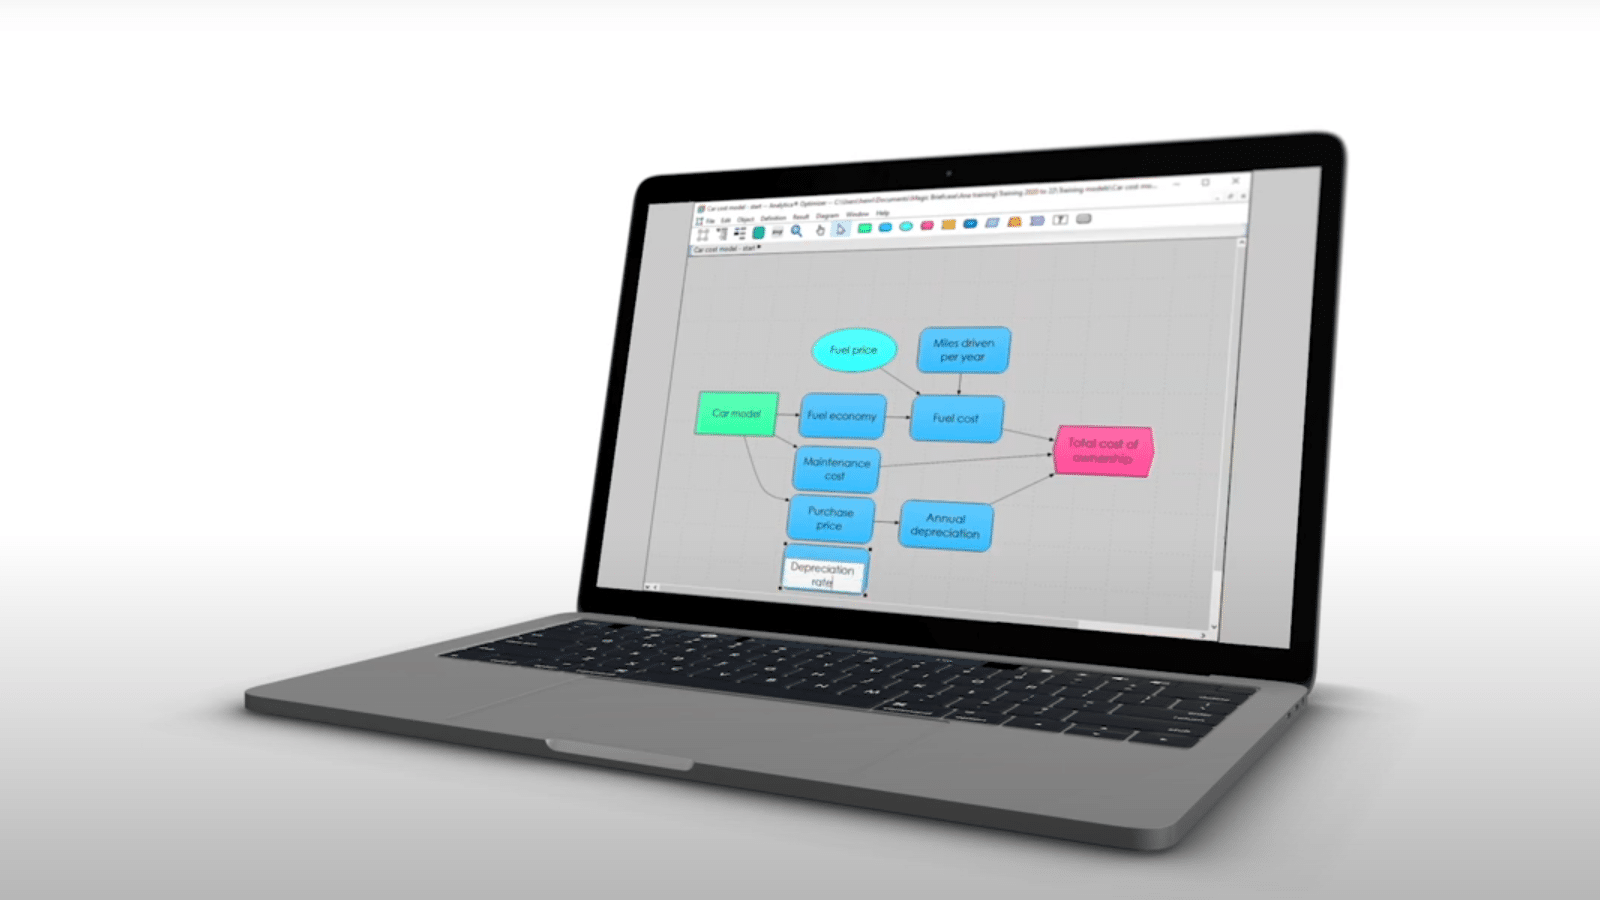
To follow along, make sure you have an edition of Analytica downloaded to your PC. Try our free edition, and follow along with our CTO Lonnie Chrisman. 

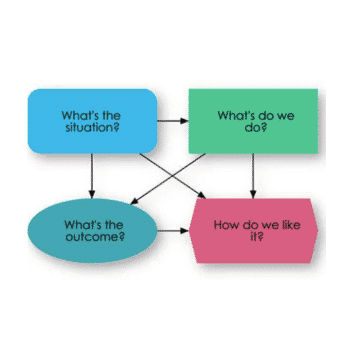
Drawing an influence diagram can help you identify what the variables are in your problem and the interrelationship between them. The best way to get started is to just start drawing. 

  1. First, make sure the edit tool is selected in the toolbar. 
  2. Drag a rectangular decision node from the toolbar to the diagram, to represent a decision that you face. In this example, Lonnie is trying to decide which of a set of possible routine medical tests to get.
  3. Now what variables are relevant to this decision. Capture these with the general variable node, the rounded rectangle. Since some tests are cheap and easy, some are expensive and invasive, the cost, and the quality of the test. All of these vary depending on which test he gets.
  4. You should draw influence arrows to indicate the relationships between the nodes. To draw an arrow, position your mouse over the starting node and then hold the mouse button down on the head of the arrow icon, while you drag it to the target node. Repeat this for the other dependent variables.
  5. When you draw an influence diagram allow yourself to change your mind often, iterate on it, critique what you have, try different things. Drawing and refining is mechanically easy, but figuring out what variables make sense for your problem is probably the most difficult and critical part of quantitative modeling. You need to refine your variables until they pass the clarity test. For example, what does quality of tests mean, that’s too ambiguous.
  6. To change the title click on the T icon. Let’s change this to “false negative rate”, instead of “what happens if I have the disease, but the test fails to detect it”.
  7. Use an oval chance variable, cost of undetected. The oval chance variable indicates that this is an uncertain estimate. Not detecting the condition might turn out to be no big deal or it might turn out to be devastating or it can be somewhere in between.
  8. You can either undraw arrows the same way you drew it by dragging from the pop-up icon or you can click on the arrow to select it and press the Delete key.
  9. Finally, the hexagon node denotes the objective or overall value of the test. Hold the shift key, as you click on the nodes to select all.

Hope this helps and happy modeling! 

Learn the basics on influence diagrams.

Share now 

See also

air conditioner outdoor unit

Building electrification: heat pump technology

Lumina set out to build a useful tool to assess the benefits of heat pumps. Learn more about heat pumps and their impact.
More...

Heat pumps 101

Heat and cool your home while saving energy and reducing emissions by adopting heat pump technology. Learn more about this transition and heat pumps by watching this webinar.
More...
Heatpump

Navigating the heat pump landscape

Fort Collins, Lumina, and Apex Analytics have created a tool to help reduce greenhouse gas emissions by optimizing building electrification programs.
More...

US gas leaks much larger than previously estimated

A new Stanford-led study on natural gas leak rates from oil and gas activity across a large fraction of the US are about 3x more than previous government estimates. The
More...

See also

Influence diagrams

Learn how Analytica's influence diagrams enhance decision-making. Discover the power of visual modeling to identify key decisions, uncertainties, and objectives.

More…

Visual modeling

Use visual influence diagrams to create and communicate your models. Identify the decisions, uncertainties, and objectives to keep the focus on what matters.

More…

User guides

These guides will help you learn how to use Analytica. You will find tutorials, libraries, and specifics on how to implement and understand different features.

More…

Introduction videos

Watch and learn! Analytica videos cover a range of topics. You’ll be building your first model in no time.

More…

Download the free edition of Analytica

The free version of Analytica lets you create and edit models with up to 101 variables, which is pretty substantial since each variable can be a multidimensional array. It also lets you run larger modes in ‘browse mode.’ Learn more about the free edition.

While Analytica doesn’t run on macOS, it does work with Parallels or VMWare through Windows.


    Analytica Cubes Pattern

    Download the free edition of Analytica

    The free version of Analytica lets you create and edit models with up to 101 variables, which is pretty substantial since each variable can be a multidimensional array. It also lets you run larger modes in ‘browse mode.’ Learn more about the free edition.

    While Analytica doesn’t run on macOS, it does work with Parallels or VMWare through Windows.


      Analytica Cubes Pattern

      Download the free edition of Analytica

      The free version of Analytica lets you create and edit models with up to 101 variables, which is pretty substantial since each variable can be a multidimensional array. It also lets you run larger modes in ‘browse mode.’ Learn more about the free edition.

      While Analytica doesn’t run on macOS, it does work with Parallels or VMWare through Windows.


        Analytica Cubes Pattern

        Download the free edition of Analytica

        The free version of Analytica lets you create and edit models with up to 101 variables, which is pretty substantial since each variable can be a multidimensional array. It also lets you run larger modes in ‘browse mode.’ Learn more about the free edition.

        While Analytica doesn’t run on macOS, it does work with Parallels or VMWare through Windows.


          Analytica Cubes Pattern

          Download the free edition of Analytica

          The free version of Analytica lets you create and edit models with up to 101 variables, which is pretty substantial since each variable can be a multidimensional array. It also lets you run larger modes in ‘browse mode.’ Learn more about the free edition.

          While Analytica doesn’t run on macOS, it does work with Parallels or VMWare through Windows.


            Analytica Cubes Pattern

            Download the free edition of Analytica

            The free version of Analytica lets you create and edit models with up to 101 variables, which is pretty substantial since each variable can be a multidimensional array. It also lets you run larger modes in ‘browse mode.’ Learn more about the free edition.

            While Analytica doesn’t run on macOS, it does work with Parallels or VMWare through Windows.


              Analytica Cubes Pattern