You might expect that the huge spike in natural gas prices arising from Russia’s war on Ukraine might have a silver lining for those seeking lower carbon emissions—making electrification, especially heat pumps, more attractive economically. Gas prices in Europe hit a peak of 340 Eur/MWh in August 2022 up by a factor of 4.5 from the February price. However, by early January 2023 European prices were back down to below pre-war prices around 70 Eur/MWh [Trading Economics]. The effect on US natural gas prices was more limited, increasing 87% from $4.7/MMBtu (Henry Hub spot price) in February to an August peak of $8.8 [EIA]. US prices are also now down again to near pre-war prices. Of course, wholesale gas prices are only a limited component of prices to customers, which include the substantial costs of transmission and distribution. California gas prices increased from an average of $18.86/MCF in February to $21.86 in August 2022 [EIA].
Residential electricity prices have also been increasing – up by around 10% from 2021 to 2022 — only in small part due to the price of gas for generation [EIA]. But as we show, it turns out that the structure of electricity tariffs – tiered, time-of-day, and seasonal pricing have much more effect on the economic appeal of heat pumps.
Rate structures
Pacific Gas & Electric Company (PG&E) offers a range of sophisticated residential electric tariffs with tiers, time-of-use and seasonal variations. Tiers are usage levels thresholds above which prices increase. Time-of-use and seasonal rates are designed to reflect how the cost of electricity generation varies by time of day and season, especially due to increasing amounts of solar generation during daylight hours. In 2022, PG&E introduced a new rate named E-ELEC for households with at least one heat pump, electric vehicle, and battery storage.
Heat pump calculator
We used Lumina’s Heat Pump Calculator to investigate past (2021 and 2022) and future (2023) bill savings of replacing gas-fired space and water heaters with heat pumps. Here are the assumptions:
- An existing gas furnace with conversion efficiency of 80% and hot water heater with efficiency of 63%.
- A 1700 square foot single-family house with 3 occupants in PG&E’s northern coastal territory (California climate zone 3).
- New HVAC heat pump and hot water heat pump with coefficients of performance (COP) of 3.1 and 3 respectively.
- Past residential gas and electric tariffs from PG&E’s website.
- According to Table 1 of PG&E’s most recent GRC, 2023 electric and gas rates are assumed to be 15.6% and 11.9% higher than respective 2022 rates for all tiers and time-of-use periods.
- Gas rate is G-1 Residential service.
First year bill savings: rate structure matters the most!
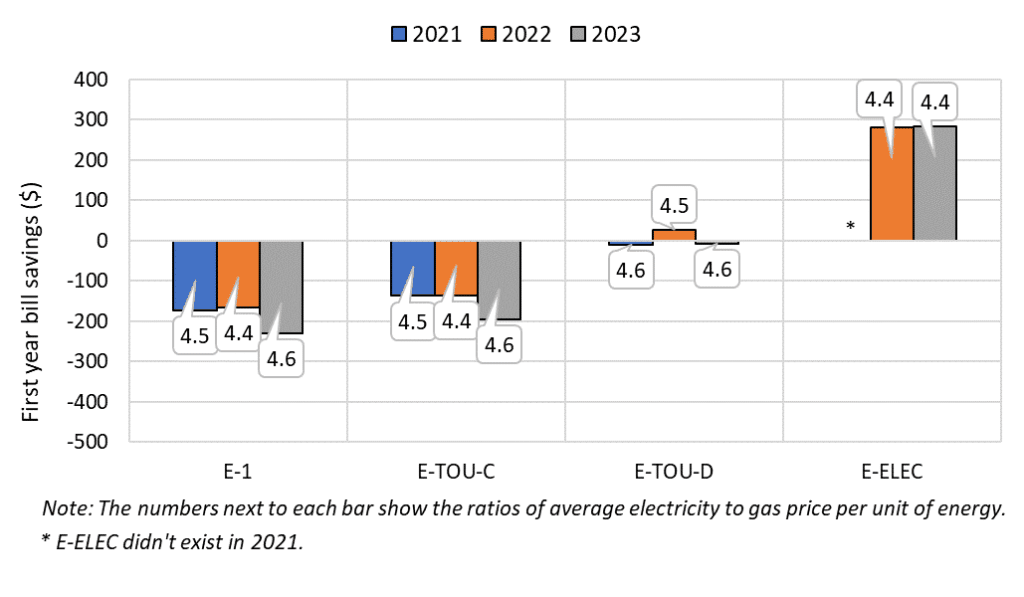
Given these assumptions, we calculated the first year bill savings for the three years across 4 electric rates. E-1 has 3 tiers (up to baseline allowance, up to four times baseline, and above that) with prices increasing by tier. E-TOU-C has 2 tiers (below baseline allowance, and above it) but E-ELEC and E-TOU-D have no tiers.E-TOU-C, and E-TOU-D, and E-ELEC are time- of- use rates. E-ELEC also has seasonal pricing with lower prices during the winter heating season.
With tier-based rates E-1 and E-TOU-C, the heat pumps cost more than gas heating. That’s mostly because heat pumps increase electrical consumption to higher price tiers. Tiered pricing inevitably discourages electrification. For E-TOU-D, which has no tiers, it’s nearly a wash. But, for E-ELEC, which was designed to encourage heat pumps with lower pricing during the winter heating season, we see net savings of around $300/year.
A common easy way to compare heat pumps against gas heaters is to compare the price ratio of electricity to gas (in $/kWh) with the efficiency gains from electrification. The numbers next to each bar in the chart show the average annual electricity to gas price ratios. For instance, in 2022, the average annual E-ELEC electricity price was 0.30 $/kWh, and the average gas price was 0.071 $/kWh. The electricity to gas price ratio in this case is 4.4 — and is higher than the heat pump to the gas furnace efficiency ratio (3/0.8=3.75). All the other price ratios (averaged over tiers, times of day, and seasons) vary from 4.4 to 4.6 — and have no visible relationship to the bill savings. While comparing price ratios with efficiency ratios might be revealing for flat electric and gas rates, it is quite misleading when dealing with sophisticated rate structures. It becomes clear that simple flat-rate assumptions are incapable of properly evaluating the economics of heat pumps with time-of-day and seasonal pricing. It is essential to consider the diurnal and seasonal variations of end-use load profiles, as performed by Lumina’s Heat Pump Calculator.
Additional resources
Learn more about heat pumps.
Building electrification: heat pump technology for California homes


