The federal income tax in the United States uses a series of increasing tax brackets, so that those who earn more pay a higher percentage of their income in taxes. This is an example of a progressive tax. The idea is simple in principle, but the IRS has managed to make it unnecessarily complex with unnecessary rounding rules and verbose tax tables. Here I’m going to dive in and decipher these needless complexities and show how trivial they could make it with some easy changes to the 1040 instructions and elimination of unnecessary rounding rules.
I’ll start with the simple concept of how the tax brackets are supposed to work. Suppose in tax year 2017 you are married filing jointly and have a taxable income of $300,000. This puts you into the 33% tax bracket, also referred to as your marginal tax rate, which means that if you were to earn $1 more, that $1 would be taxed at 33%. It does not mean that you pay 33% tax on the full $300,000. Instead, you pay the lowest tax rate of 10% on your first $18,650 of taxable income, then 15% on the next $57,250, on through the tax brackets up to your tEXotal taxable income, as depicted in here:
Example for 2017 Tax on $300,000 = |
|
Your effective tax rate is $74217 / 300000 = 24.7%.
The idea of taxing the first $18,650 at 10%, and so on, is important when you consider what happens at the tax bracket boundaries. If you make $153,099, you fall into the 15% tax bracket, but if you make one dollar more, $154,100, you fall into the 25% tax bracket. There is a principle that you shouldn’t be worse off for earning $1 more. If it were set up so that you just multiply your tax bracket rate by your total taxable earnings. your tax due would jump from $22,965 to $38,275 as a result of earning that one extra dollar, reducing your tax home earnings by $15,309. In contrast, this system of paying the lower rates for the first dollars earned causes your tax due from that extra $1 to increase by only $0.25.
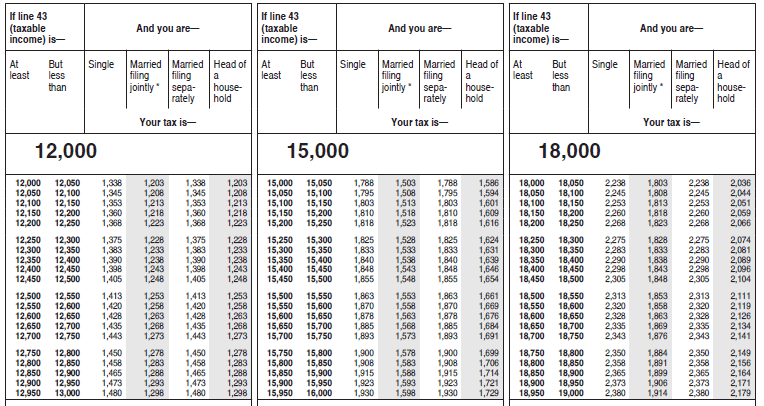
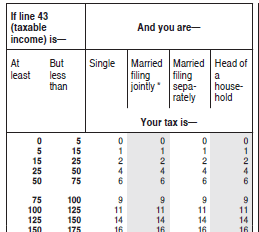
Consider another example of a married filing jointly filer with an income of $18,000. Here the tax due should be just 10% * $18,000 = $1,800. But as it turns out, the tax tables show the actual tax to be $1,803. Although the difference here is only $3, the fact that it isn’t the simple calculation forces every tax filer to weed through the complexities of the tax tables instead of just carrying out one simple multiplication. It also means that if you want to automate the tax calculation in your own models or spreadsheets, you can’t just implement the simple math, but instead you must figure out the needlessly complex and seemingly inconsistent rounding rules.
When your are filling out your own federal tax return, after you’ve figured out the number for your taxable income on line 43 of your Form 1040, you then need to consult the 13 pages tax tables spanning Pages 78-90 in the printed form 1040 instructions. Twelve of those 13 pages contain three columns per page with each column containing multiple 6-column tables, a portion of which is shown here.
Table 1
Quite frankly, pages 78-89 are a waste of paper and complexity. To the IRS’s credit, page 90 was well done, but is useful only to filers with a taxable income in excess of $100,000. But to figure out that you need to use the tables on page 90, you have to scan past the other 12 pages of tables to get to page 90. Page 90 contains worksheets like the one shown here for married filing jointly (this is from tax year 2017 instructions)
Worksheet 1:
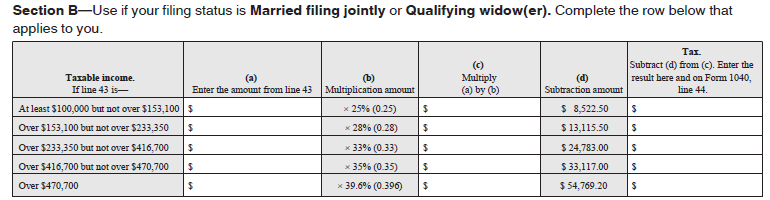
Things would be a whole lot simpler if this worksheet were extended to all income levels. I proposed that the 12 pages of tax tables should be replaced with this worksheet extended to include income levels under $100,000.
| Taxable income If taxable income (on line 43) is | (a) Enter amount from line 43 on one row only | (b) Multiplication amount | (c) Multiply (a) by (b) | (d) Subtraction amount | Tax Subtract (d) from (c) | |
|---|---|---|---|---|---|---|
| Over | but not over | |||||
| $0 | $18,650 | x 10% (0.1) | $0 | |||
| $18,650 | $75,900 | x 15% (0.15) | $932.50 | |||
| $75,900 | $153,100 | x 25% (0.25) | $8,522.50 | |||
| $153,100 | $233,350 | x 28% (0.28) | $13,115.50 | |||
| $233,350 | $416,700 | x 33% (0.33) | $24,783.00 | |||
| $416,700 | $470,700 | x 35% (0.35) | $33,117.00 | |||
| $470,000 | — | x 39.6% (0.396) | $54,769.20 | |||
This is concise, easy to use, and easy to implement in software, spreadsheet or your own model. For example, in an Analytica model, you could implement this as follows.
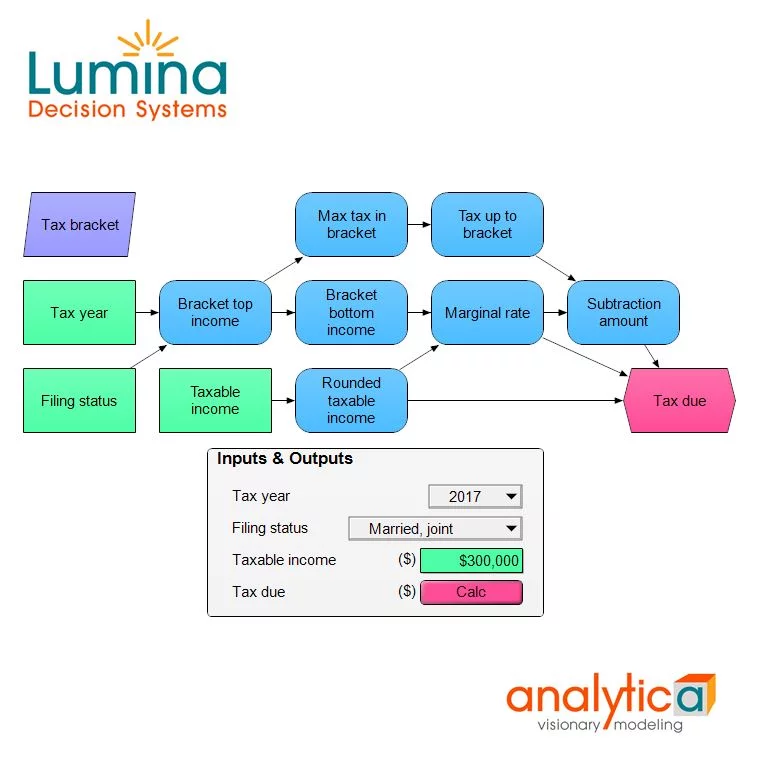
- Variable Taxable_income :=
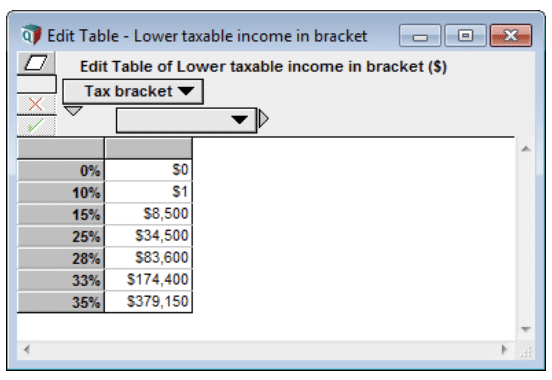
300K - Index Tax_bracket :=
[ 10%, 15%, 25%, 28%, 33%, 35%, 39.6% ] - Decision Filing_status :=
Choice(Self,2) - Domain Filing_status :=
['Single', 'Married, joint', 'Married, separate', 'Head'] - Variable Bracket_top_income :=
DetermTable(Tax_bracket, Filing_status) - Variable Marginal_rate :=
StepInterp( Bracket_top_income, Tax_bracket, Taxable_income, Tax_bracket )
Domain of Marginal_rate :=Tax_bracket - Variable Subtraction_amount :=
(Bracket_bottom_income * Tax_bracket - Tax_up_to_bracket)[Tax_bracket=Marginal_rate, defVal:0] Variable Tax_due :=Round( Taxable_income * Marginal_rate - Subtraction_amount)
We can improve on this by computing Subtraction_amount from the other information, rather than relying on the table to be populated.
- Vracket_bottom_income :=
Bracket_top_income[@Tax_bracket = @Tax_bracket-1,defval:0] - Variable Max_tax_in_bracket :=
Uncumulate( Bracket_top_income, Tax_bracket ) * Tax_bracket - Variable Tax_up_to_bracket :=
Cumulate( Max_tax_in_bracket, Tax_bracket)[@Tax_bracket=@Tax_bracket-1, defVal:0] - Variable Subtraction_amount := (
Bracket_bottom_income * Tax_bracket - Tax_up_to_bracket)[Tax_bracket=Marginal_rate, defVal:0]ariable B
In this computation, Bracket_bottom_income is the income level where the tax bracket starts (whereas Bracket_top_income is the income level where the bracket ends), and Tax_up_to_bracket is the total tax paid in all preceeding brackets. The subtraction amount is then easily computed as the difference between the tax rate multiplier by the income level that the bracket starts at, minus the actual tax at the income level the bracket starts at.
This model, and the proposed worksheet, computes a tax of $1,800 on a taxable_income of $18,000, whereas Table 1 above from the IRS Tax tables says the tax should be $1,803. The tax table has an interval of incomes from $18,000 to $18,050, all of which map to $1,803 for married filing jointly. The $1,803 appears to be the tax on the average income for the interval, which would be $1,802.50, rounded up to the nearest dollar, $1,803. However, when you look up an income between $3,200 and $3,250,
In this case, the interval width is $50, but elsewhere the tax tables use an interval widths of 5, 10 and 25, as seen in this portion.
Table 2
To match the interval widths from the IRS table lookups, and compute the mid point for these intervals, we need extra logic, as follows.
Variable Rounded_taxable_income :=
If Taxable_income<5 Then 0
Else If Taxable_income<15 Then 10
Else If Taxable_income<25 Then 20
Else If Taxable_income <3000 Then Floor(Taxable_income /25)*25 + 12.5
Else If Taxable_income <100k Then Floor(Taxable_income /50)*50 + 25
Else Taxable_income
This variable identifier must be used in the Definition of Tax_due instead of Taxable_income as follow
- Variable Tax_due :=
Round( Taxable_income * Marginal_rate - Subtraction_amount )
The resulting computations now agree with the IRS 2017 tax tables, Currently you cannot use Proposed Worksheet 2 for taxable income levels below $100,000 since it does not reproduce the IRS’s rounding rules. It took me a considerable amount of time to reverse engineer the rounding from the tables, and to confirm that this is consistent for the full table. Others who want to build computational models with correct tax amounts face the same challenge (except those of you reading this, who know how it is done). We here a lot of talk about simplifying taxes, here is a small opportunity.
There have been arguments that the tax code could be simplified by reducing the number of tax brackets. I have to opine that reducing the number of brackets is an insignificant simplification. Once you have a system that uses progressive tax brackets, the number of brackets doesn’t change the complexity in my mind. The number of rows on each proposed worksheet would change accordingly, which might enable four worksheets to fit on one page, where my proposal would require about 1 1/3 pages. But in terms of the impact on a computational model, the above model, you’d just changed the elements of the Tax_bracket index and adjust the numbers in the Bracket_top_income table. That’s a miniscule change to data complexity, but no change to model complexity.
If you’d like to play with my model, just download the model file and open it in Analytica Free Edition. Many depreciation calculations are also quite similar in structure, and hence you may find this useful for that purpose. If you are learning Analytica, a nice challenge is to compute the tax due using either the Dispatch( ) function or the StepInterp( ) function, without using Subtraction_amount.